


The stock market is not always right or rational, or is it just early? It makes investors scratch their heads when a company reports earnings that miss analyst expectations, but the stock goes higher. Does the market see something most investors don't?
Is it early or really forward-thinking? Just as a stock that runs up into an earnings release can set itself up for a "sell the news" price drop even after reporting strong earnings, a stock can trigger a rally on a weak earnings report.
The rally could imply that the worst may be behind it and the future looks brighter. Or that the worst case was already priced into the stock heading into the earnings report, and it wasn’t as bad as expected. A high short float could also perpetuate a short squeeze to add to the recovery momentum.
Whether the explanations were curve-fitted is something that's only realized in hindsight. Here are two stocks that missed analyst expectations, gapped down the next morning, but then rallied higher.
BJ’s Restaurants Inc. (NASDAQ: BJRI)
Founded in 1978, BJ’s Restaurants operates over 215 restaurants in 30 states in the United States. It’s a member of the consumer discretionary sector. The casual restaurant chain operates under various banners, including BJ's Restaurant and Brewery, BJ's Restaurant and Brewhouse, BJ's Grill and BJ's Pizza & Grill. They serve a wide range of comfort foods, from pizza pasta to burgers, salads and sandwiches, and craft beers and cocktails.
Weak bottom line
On Oct. 26, 2023, BJ’s reported its Q3 2023 earnings for September 2023. The company reported a loss of 16 cents per share, missing consensus analyst estimates for a loss of 1 cent by 15 cents. Net loss was $3.8 million, compared to a net loss of $1.6 million in the year-ago period. However, that included the $4.1 million income tax benefit reflected in the estimated annual effective tax rate.
Margin improvement from cost savings
Restaurant-level operating margin was 11.9% versus 10.3% in the year-ago period. Adjusted EBITDA rose to $19.6 million compared to $15.2 million in Q3 2022. Revenues rose 2.3% YoY to $318.64 million, beating analyst estimates of $325.88 million. Comparable restaurant sales increased 0.4%, while total restaurant operating weeks increased 0.8%.
The company continues progressing on its cross-functional cost savings initiatives, improving margins and realizing over $30 million in annualized savings to date. Sales normalized in Q3 2023 to a typical seasonal pattern consistent with industry trends of lower sales volumes in August and September. The company reinstituted its stock buyback program with $17.8 million remaining in its authorized repurchase program.
CEO Insights under the hood
BJ's Restaurants CEO Greg Levin pointed out some metrics under the headline numbers. Restaurant-level operating margin was improved by 160 bps, which increased Adjusted EBITDA by 30% YoY. He noted that BJ’s comp sales beat industry averages for the 10th consecutive quarter. BJ's generated over $76 million of adjusted EBITDA in 2023.
The company rolled out a new menu with 15% fewer items, focusing more on the favorites based on guest research. It's also continuing its remodeling program to a lighter, more contemporary bar design, adding a 130-inch television. BJ's is targeting 35 to 40 remodels this year. New restaurant openings will be similar in 2024.
BJ's Restaurants analyst ratings and price targets are at MarketBeat. BJ’s Restaurants peers and competitor stocks can be found with the MarketBeat stock screener.
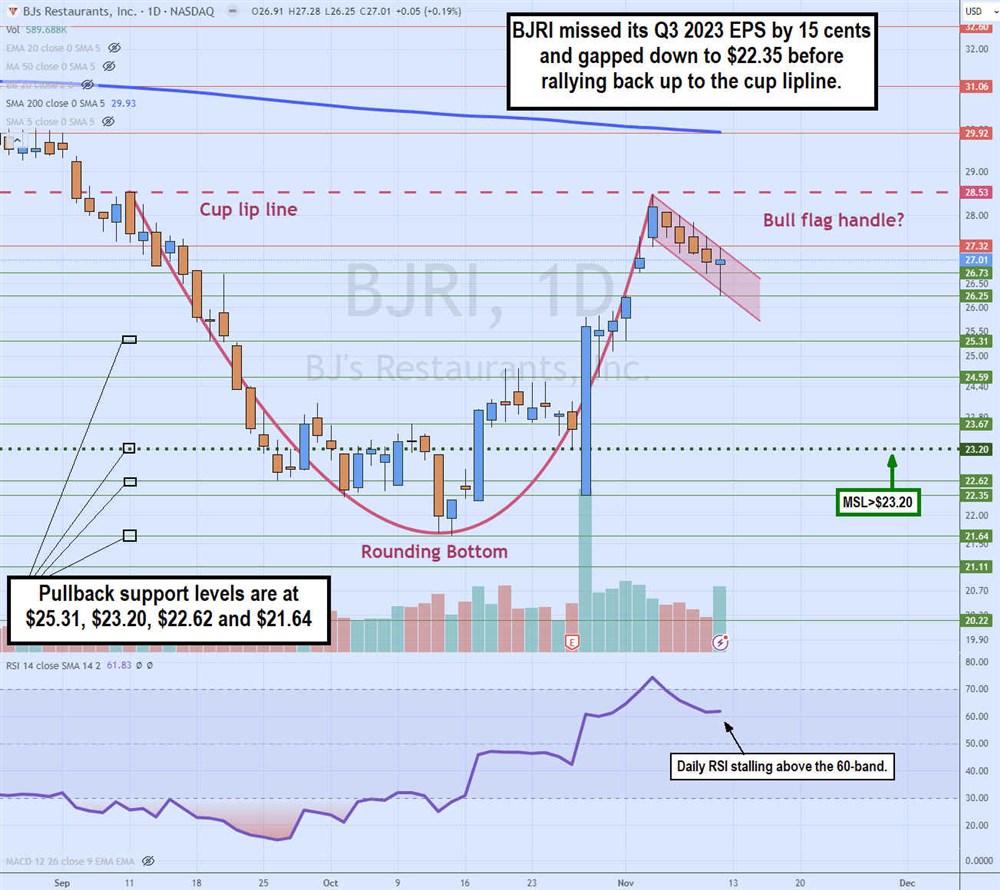
Daily cup and handle with a bull flag trigger
The daily candlestick chart on BJRI illustrates a cup and handle with a bull flag trigger pattern. The cup lip line formed at $28.53 on Sept. 11, 2023. BJRI collapsed to a low of $21.64 on Oct. 13, 2023, to form a daily market structure low (MSL) breakout through the $23.20 trigger. BJRI formed a rounding bottom.
Shares initially gapped down on earnings to $22.35 but managed to grind higher by 8.6% by the end of the day, closing at $25.61 on Oct. 27, 2023. Shares rallied for five days to retest the cup lip line at $28.53 before forming a potential bull flag handle.
The daily relative strength index (RSI) rallied through the 70-band but has since fallen back under the flag formation. Pullback supports are at $25.31, $23.20 daily MSL trigger, $22.62 and $21.64.
Tractor Supply Co. (NASDAQ: TSCO)
The Tractor Supply Co. is the largest lifestyle products retailer in the United States. It sells many products for farmers, ranchers, home, land, livestock, and pet owners. It sells various industrial-grade tractors, power tools, mowers, and feed and garden supplies, many under its private-label brands.
The company operates over 2,200 stores across the country. It has stores under the Tractor Supply, Orscheln Farm, Home, and Petsense logos. The company is expanding and opening new locations, as evidenced by the 17 new Tractor Supply stores opened in Q3 2023, bringing the total to 2,198 locations. For the rural lifestyle, tractor Supply is like a rural version of Home Depot Inc. (NYSE: HD).
Weak Q3 2023 results
On Oct. 26, 2023, Tractor Supply reported Q3 2023 earnings of $2.25 per share, missing estimates by 4 cents. Revenues grew 4.3% YoY to $3.41 billion, missing consensus analyst estimates of $3.46 billion. Comparable same-store sales declined 0.4%.
Tractor Supply CEO Hal Lawton admitted the soft performance, “We delivered solid growth in both net sales and earnings in the third quarter, although our sales performance was softer than our expectations. Given this environment, we have updated our outlook for the year to reflect continued unfavorable seasonal category performance and discerning consumer spending. Our consistent market share expansion and positive customer trends underscore the enduring strength of our business.”
Lowered guidance
Tractor Supply lowered full-year 2023 EPS guidance to $10.00 to $10.10, from previous forecasts of $10.20 to $10.40, versus $10.22 consensus analyst estimates. Full-year 2023 revenues are expected to be between $14.50 billion and $14.60 billion, down from earlier estimates of $14.80 billion to $14.90 billion versus consensus analyst estimates of $14,81 billion. Sale store sales comps were lowered to flat, down from earlier guidance of 1.3% to 2.5% growth.
Tractor Supply analyst ratings and price targets are at MarketBeat.
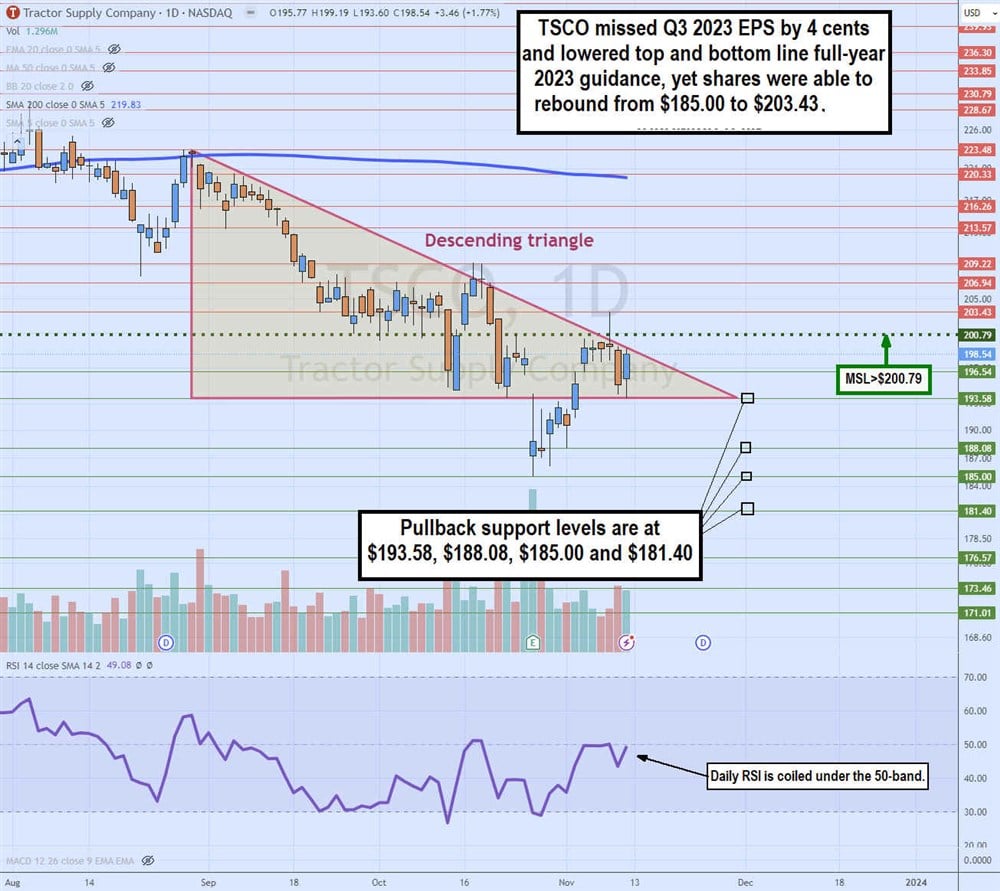
Daily descending triangle
The daily candlestick chart on TSCO illustrates a descending triangle pattern. The descending trendline formed upon peaking at $223.48 and falling under the daily 200-period MA on Aug. 30, 2023. TSCO made lower highs on the sell-off to a flat-bottom lower trendline at $193.58 on Oct. 23, 2023.
The weekly MSL triggers above $200.79. TSCO shares gapped after its Q3 2023 earnings report and lowered guidance on Oct. 26, 2023. Shares bounced back up through the lower trendline and into the descending triangle range. TSCO even triggered a weekly MSL breakout to peak at $203.41 before slipping down under the descending trendline. The daily RSI is stuck at the 50-band. Pullback support levels are $193.58, $188.08, $185.00 and $181.40.
