


AMC Entertainment Holdings, Inc. (AMC), notably of the meme-stock fame, has been hit by a wave of bearish options bets lately. Reuters reported that, as of last Thursday, the one-month moving average of open puts versus call options on AMC hit 1.7-to-1, the most bearish in four years.
The company had issued preferred shares (APE) to raise capital. In March, the company announced that shareholders had approved combining AMC common shares and APE units. Should this happen, traders expect the common stock price to fall while the APE shares will rise in value.
Let’s look at the trends of AMC’s key financial metrics to understand why it could be wise to avoid the stock now.
Analyzing AMC's Financial Performance and Trends from 2020 to 2023
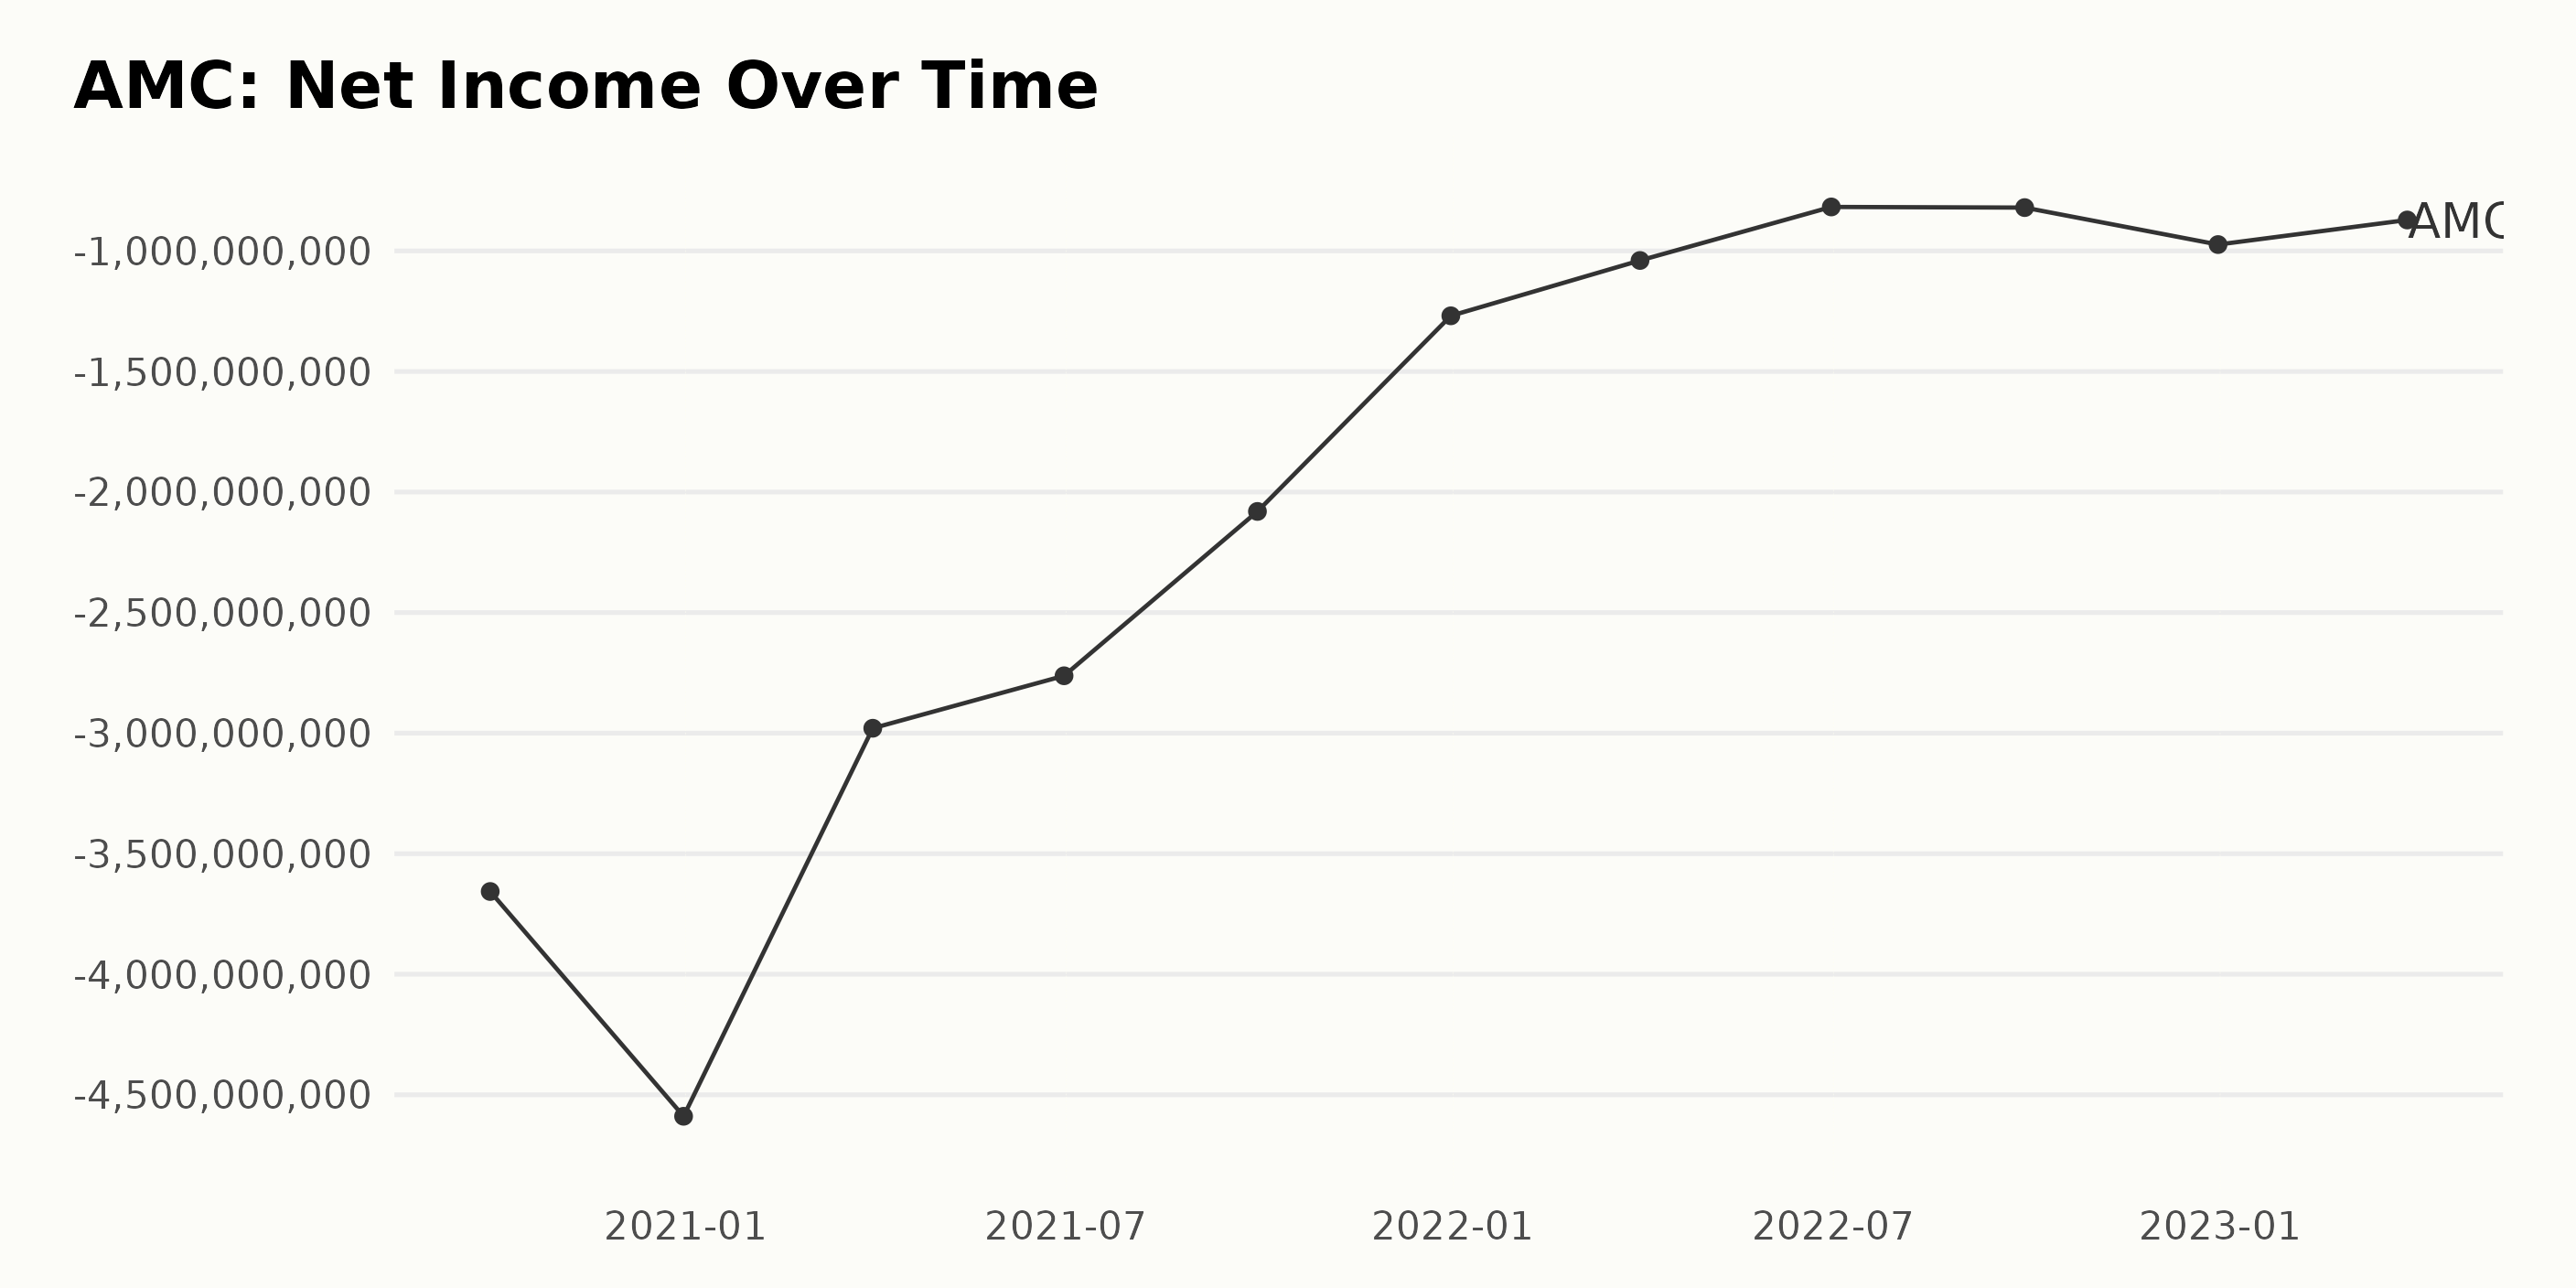
From a detailed observation of the trailing-12-month net income data for AMC, spanning from 2020 to 2023, several key trends and fluctuations can be noted:
- On September 30, 2020, the net income was at a significant low of -$3.66 billion.
- By December 31, 2020, there was a further decline in net income to -$4.59 billion.
- In 2021, however, there was an evident improving trend throughout the year. On March 31, net income was at -$2.98 billion; by June 30, it reached -$2.76 billion. The improvement continued till the end of 2021, when on December 31, net income stood at -$1.27 billion.
- Progressing into 2022, the net income continued to decrease with values at -$1.04 billion, -$817.6 million, and -$820.3 million for each quarter, respectively, until a drop to -$973.6 million was observed at the close of the year on December 31, 2022.
- The first quarter of 2023 recorded a slight loss reduction, with net income at -$871.7 million on March 31.
Noteworthy is the gradual shrinking of net income losses from a staggering -$4.59 billion in December 2020 to -$871.7 million by March 2023. This change represents a significant positive shift in AMC's financial performance over the period under review. However, it's important to point out the unexpected drop to -$973.6 million within the final quarter of 2022.
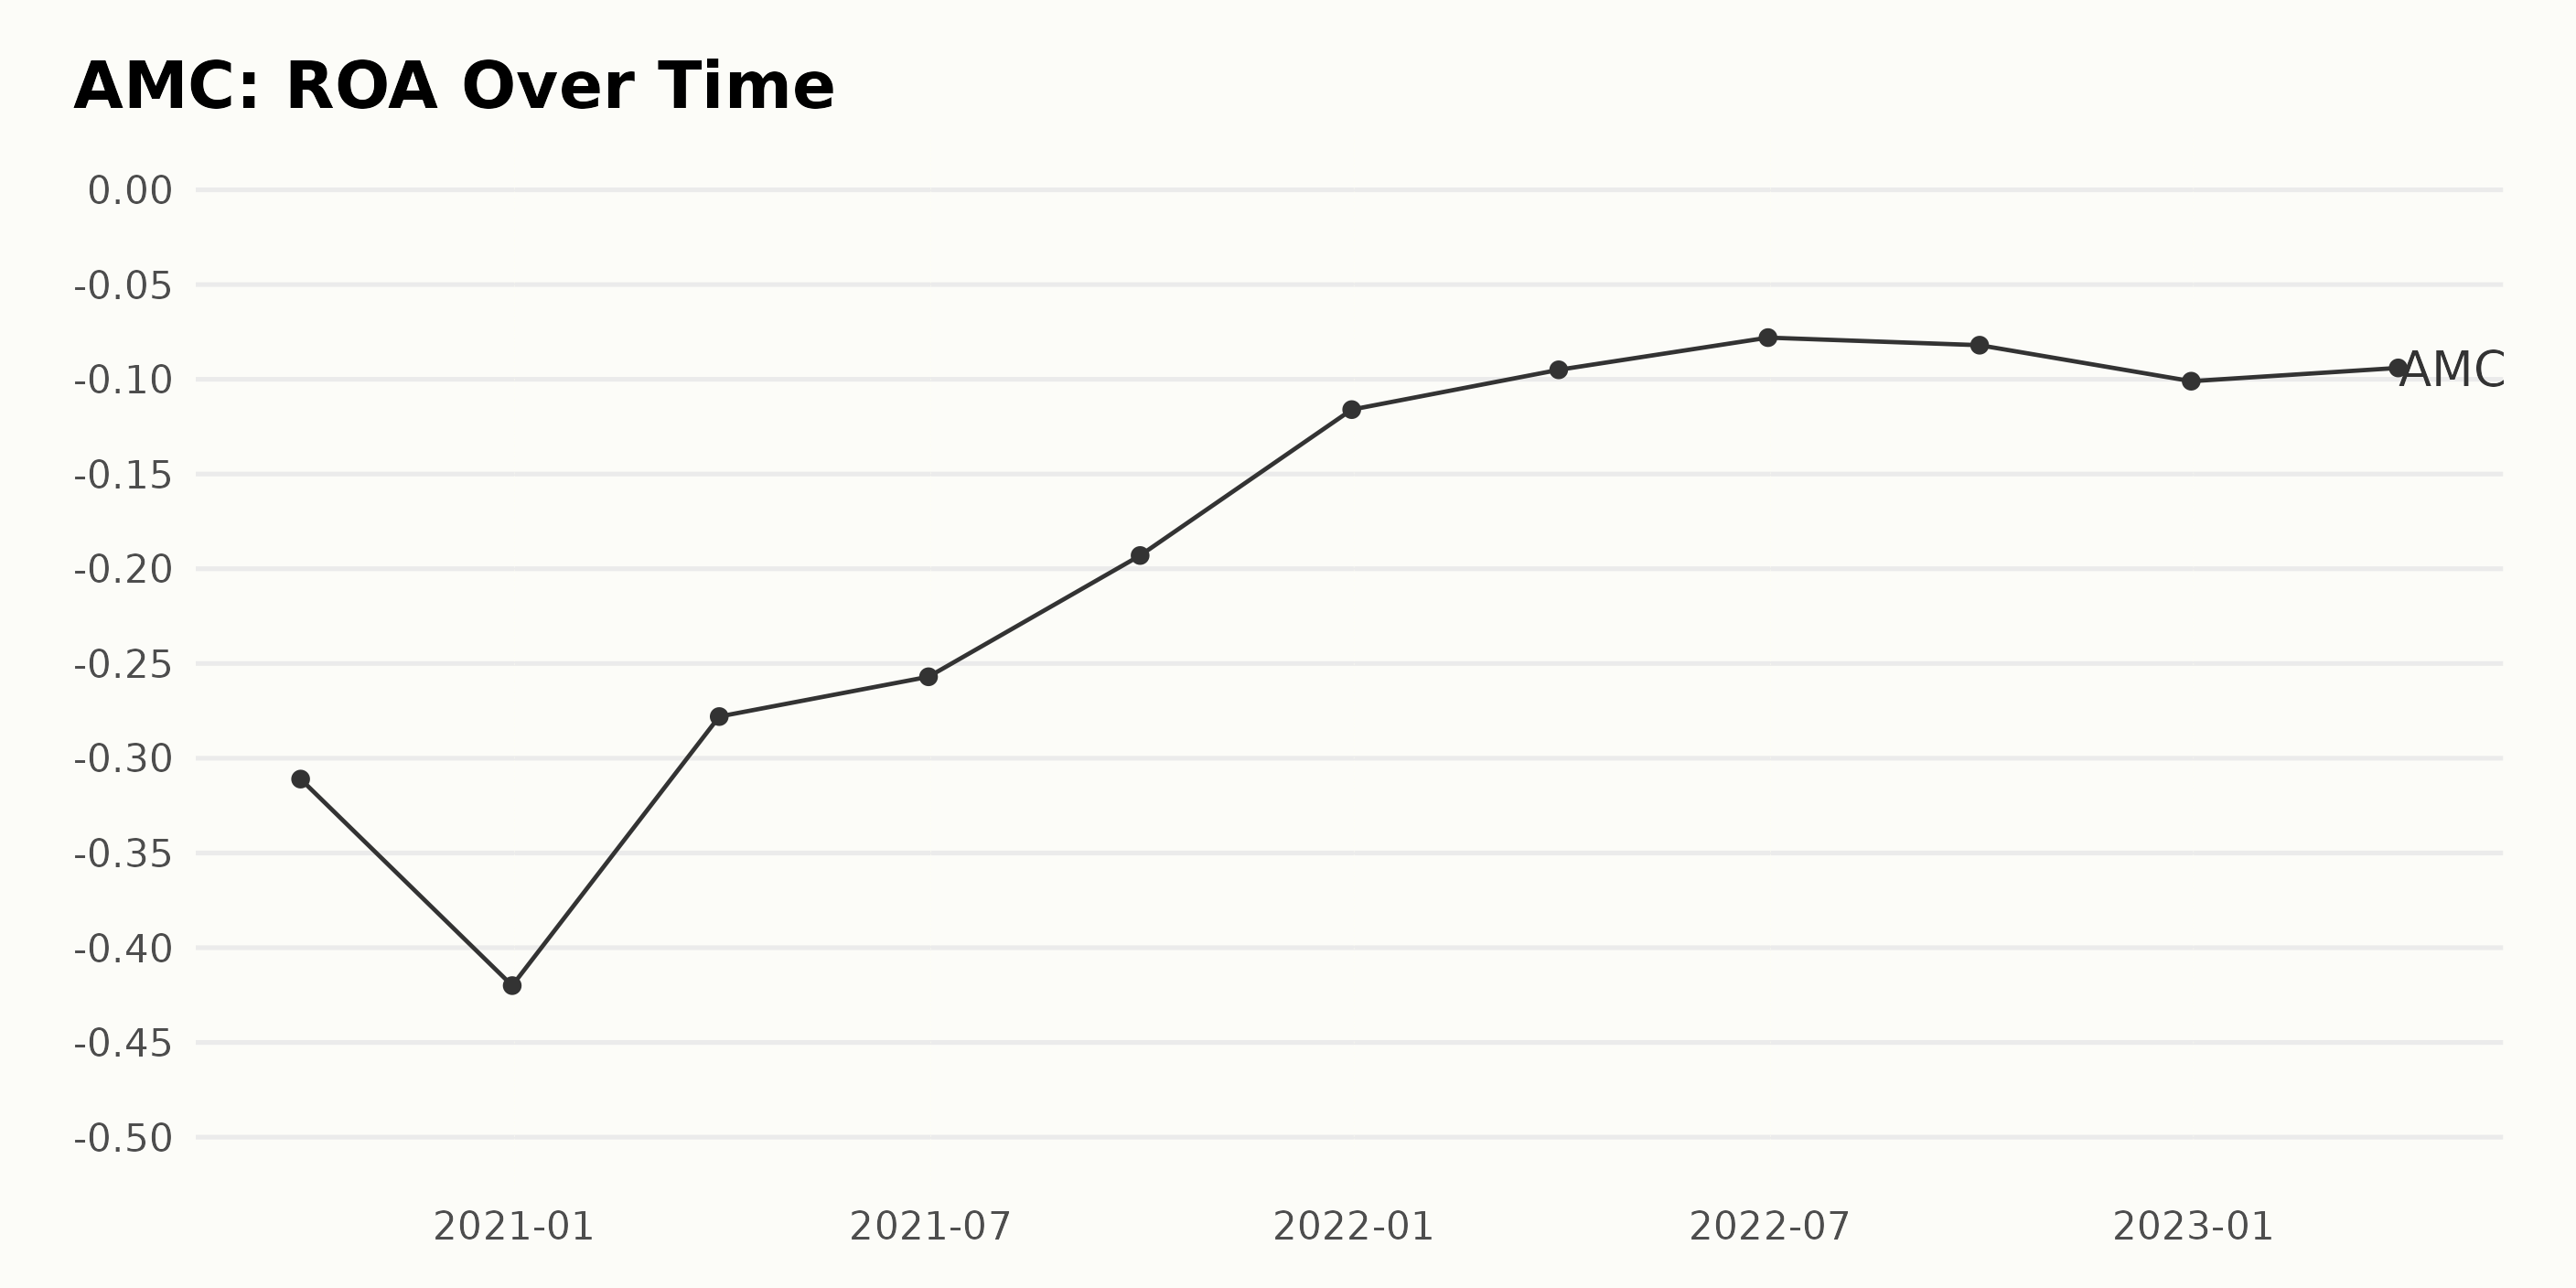
The ROA of AMC shows a fluctuating trend with an overall improvement over the tracked period.
- On September 30, 2020, the ROA was -31.1%.
- There was a drop to -42.0% by December 31, 2020.
- From the start of 2021 until the end of the year, the figures show a steady improvement, with ROA hitting -11.6% on December 31, 2021.
- In 2022, the ROA continued to improve, reaching -7.8% by June. However, there was a small bump on September 30, 2022, with the ROA coming to -8.2%.
- At the end of 2022, the ROA had moderately increased to -10.1%.
- As of March 31, 2023, the most recent value shows a slight improvement to -9.4%.
By examining the first and last value in this series, the ROA of AMC has seen a growth rate of approximately 69.45% from September 30, 2020, to March 31, 2023. Despite some fluctuations, the general trend for AMC's ROA has improved over this period.
However, it is still trending in the negative. It's crucial to continually monitor these figures as they play a significant role in understanding the company's profitability relative to its total assets.
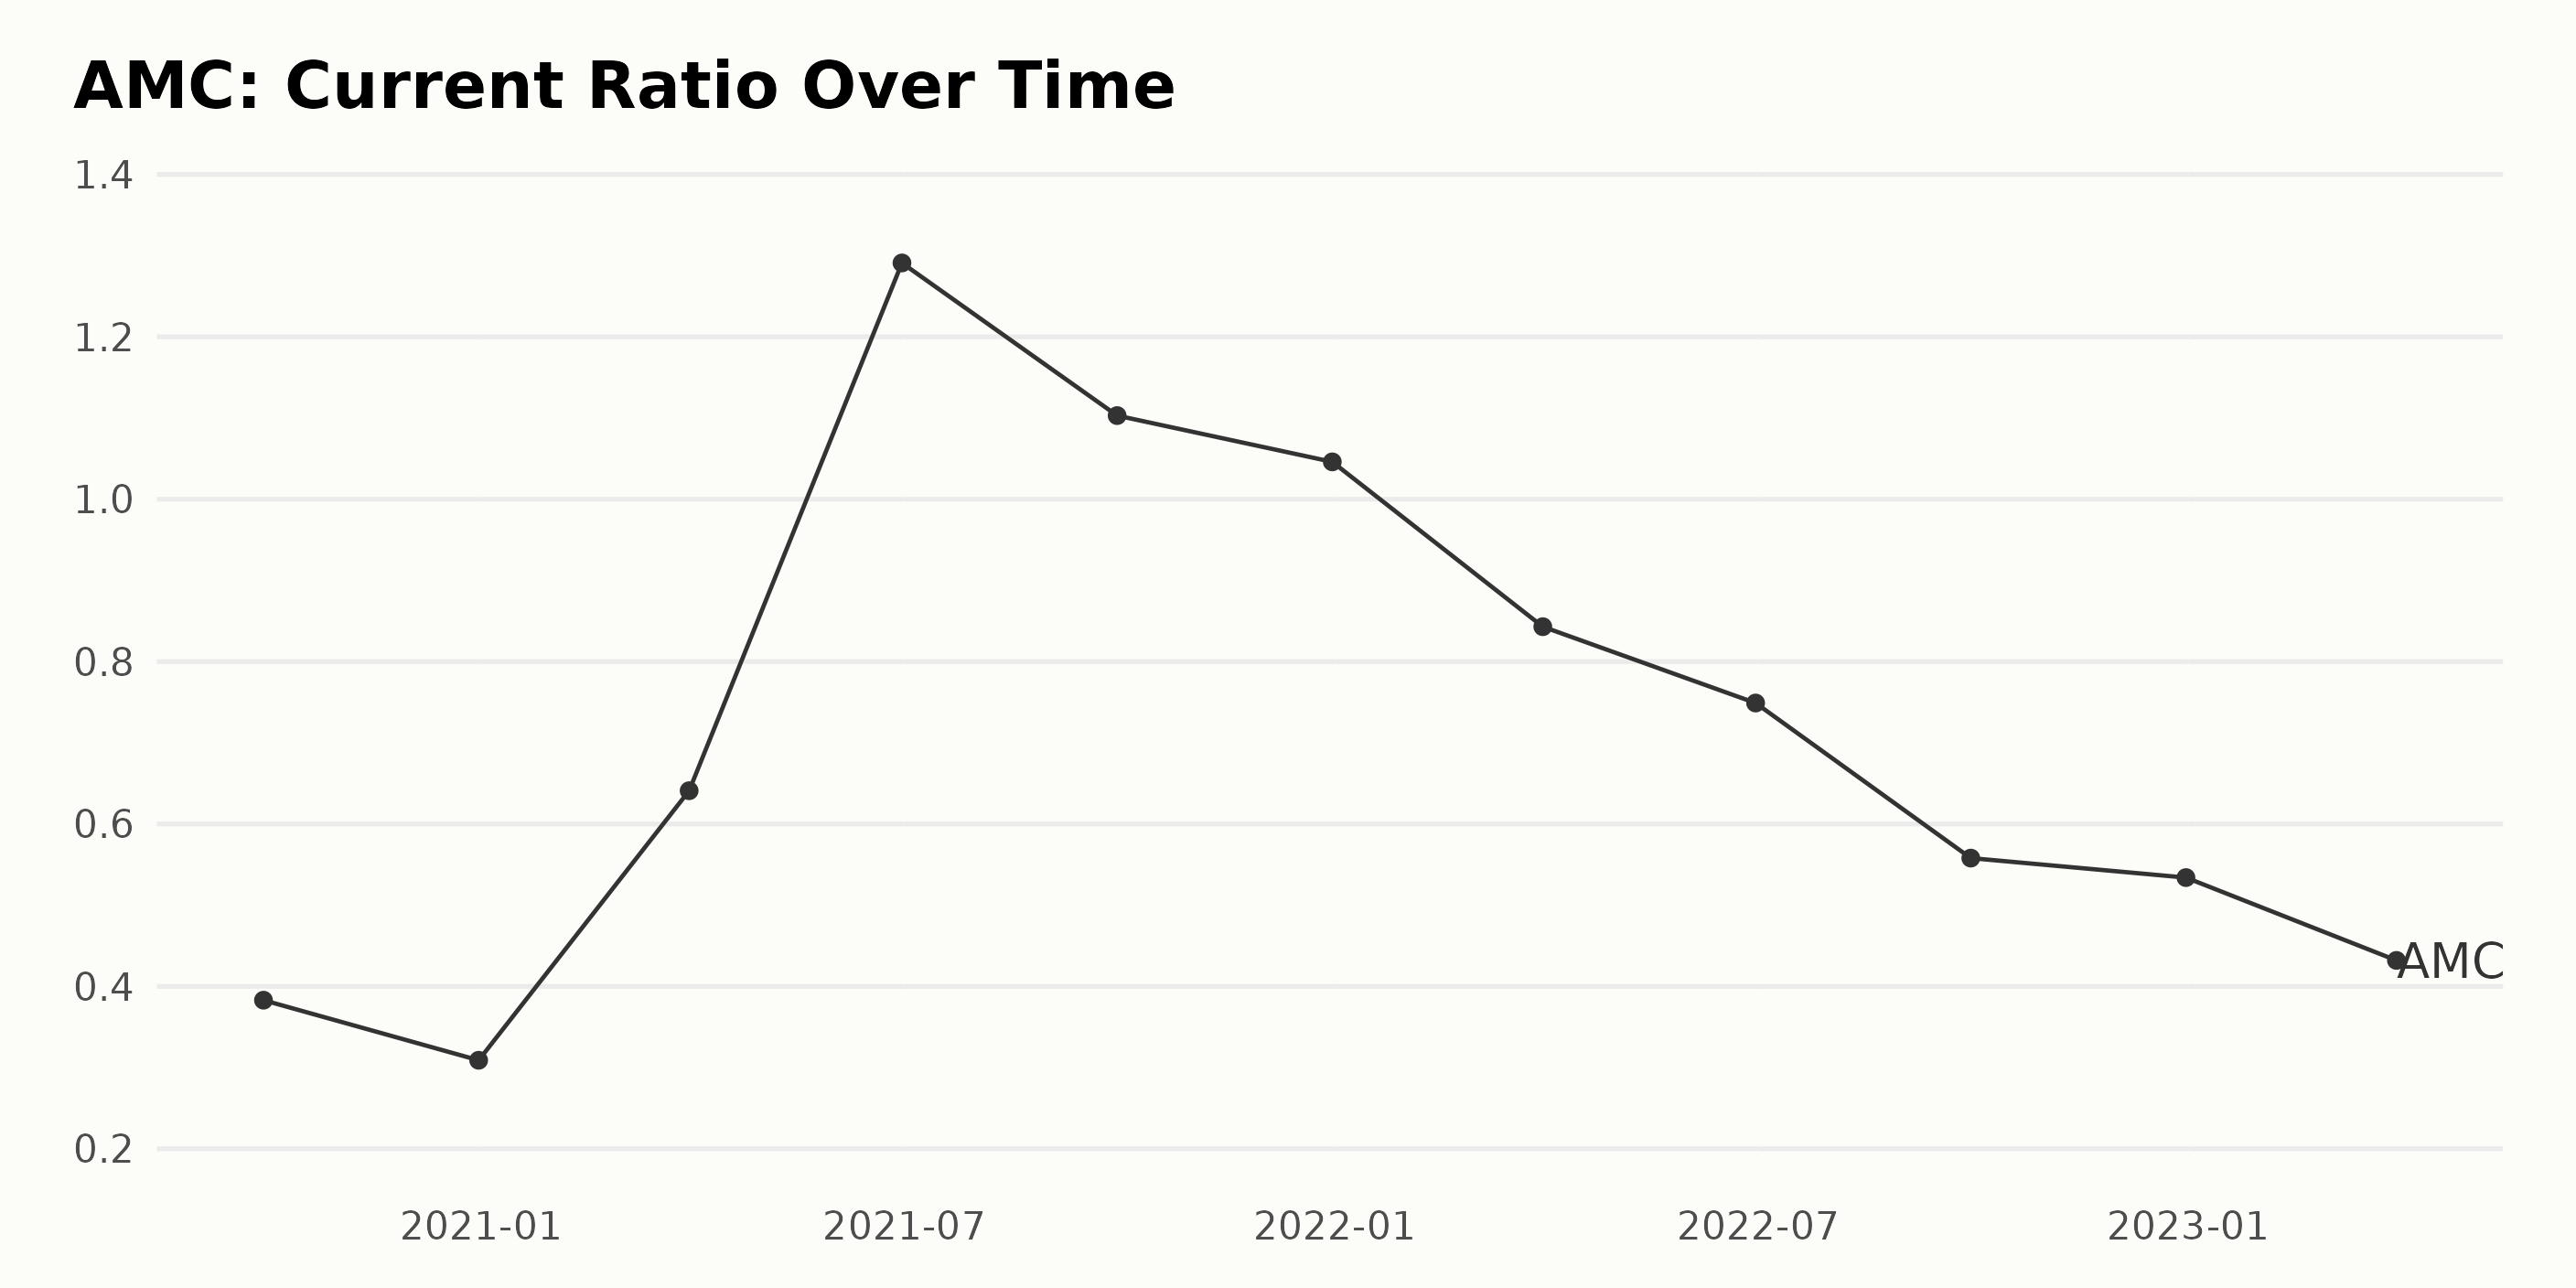
The series reflects the current ratio of AMC from September 2020 to March 2023. Here is a summarized trend and fluctuations:
- At the start of the series, on September 30, 2020, the current ratio was 0.38.
- It then underwent a decline, reaching 0.31 by December 31, 2020.
- In an upward surge, the ratio jumped to 0.64 by the end of March 2021 and reached a peak of 1.29 by June 30, 2021.
- Following this, there has been a generally downward trend, with minor fluctuations amidst the fall. By September 30, 2021, the ratio had reduced to 1.10 and dropped to 1.04 by the end of 2021.
- In 2022, the current ratio kept declining. By March 31, 2022, it dropped to 0.84 and continued to fall, ending at 0.75 by June 30, 2022.
- The last quarter of 2022 experienced further deterioration in the company's current ratio: 0.56 by September 30 and 0.53 by the end of the year.
- As of March 31, 2023, the last value in the data series shows a further decrease to 0.43.
The growth rate, calculated by measuring the last value from the first value, is -65%. This indicates a substantial overall reduction in the company's current ratio from September 2020 to March 2023, implying a weakening liquidity position.
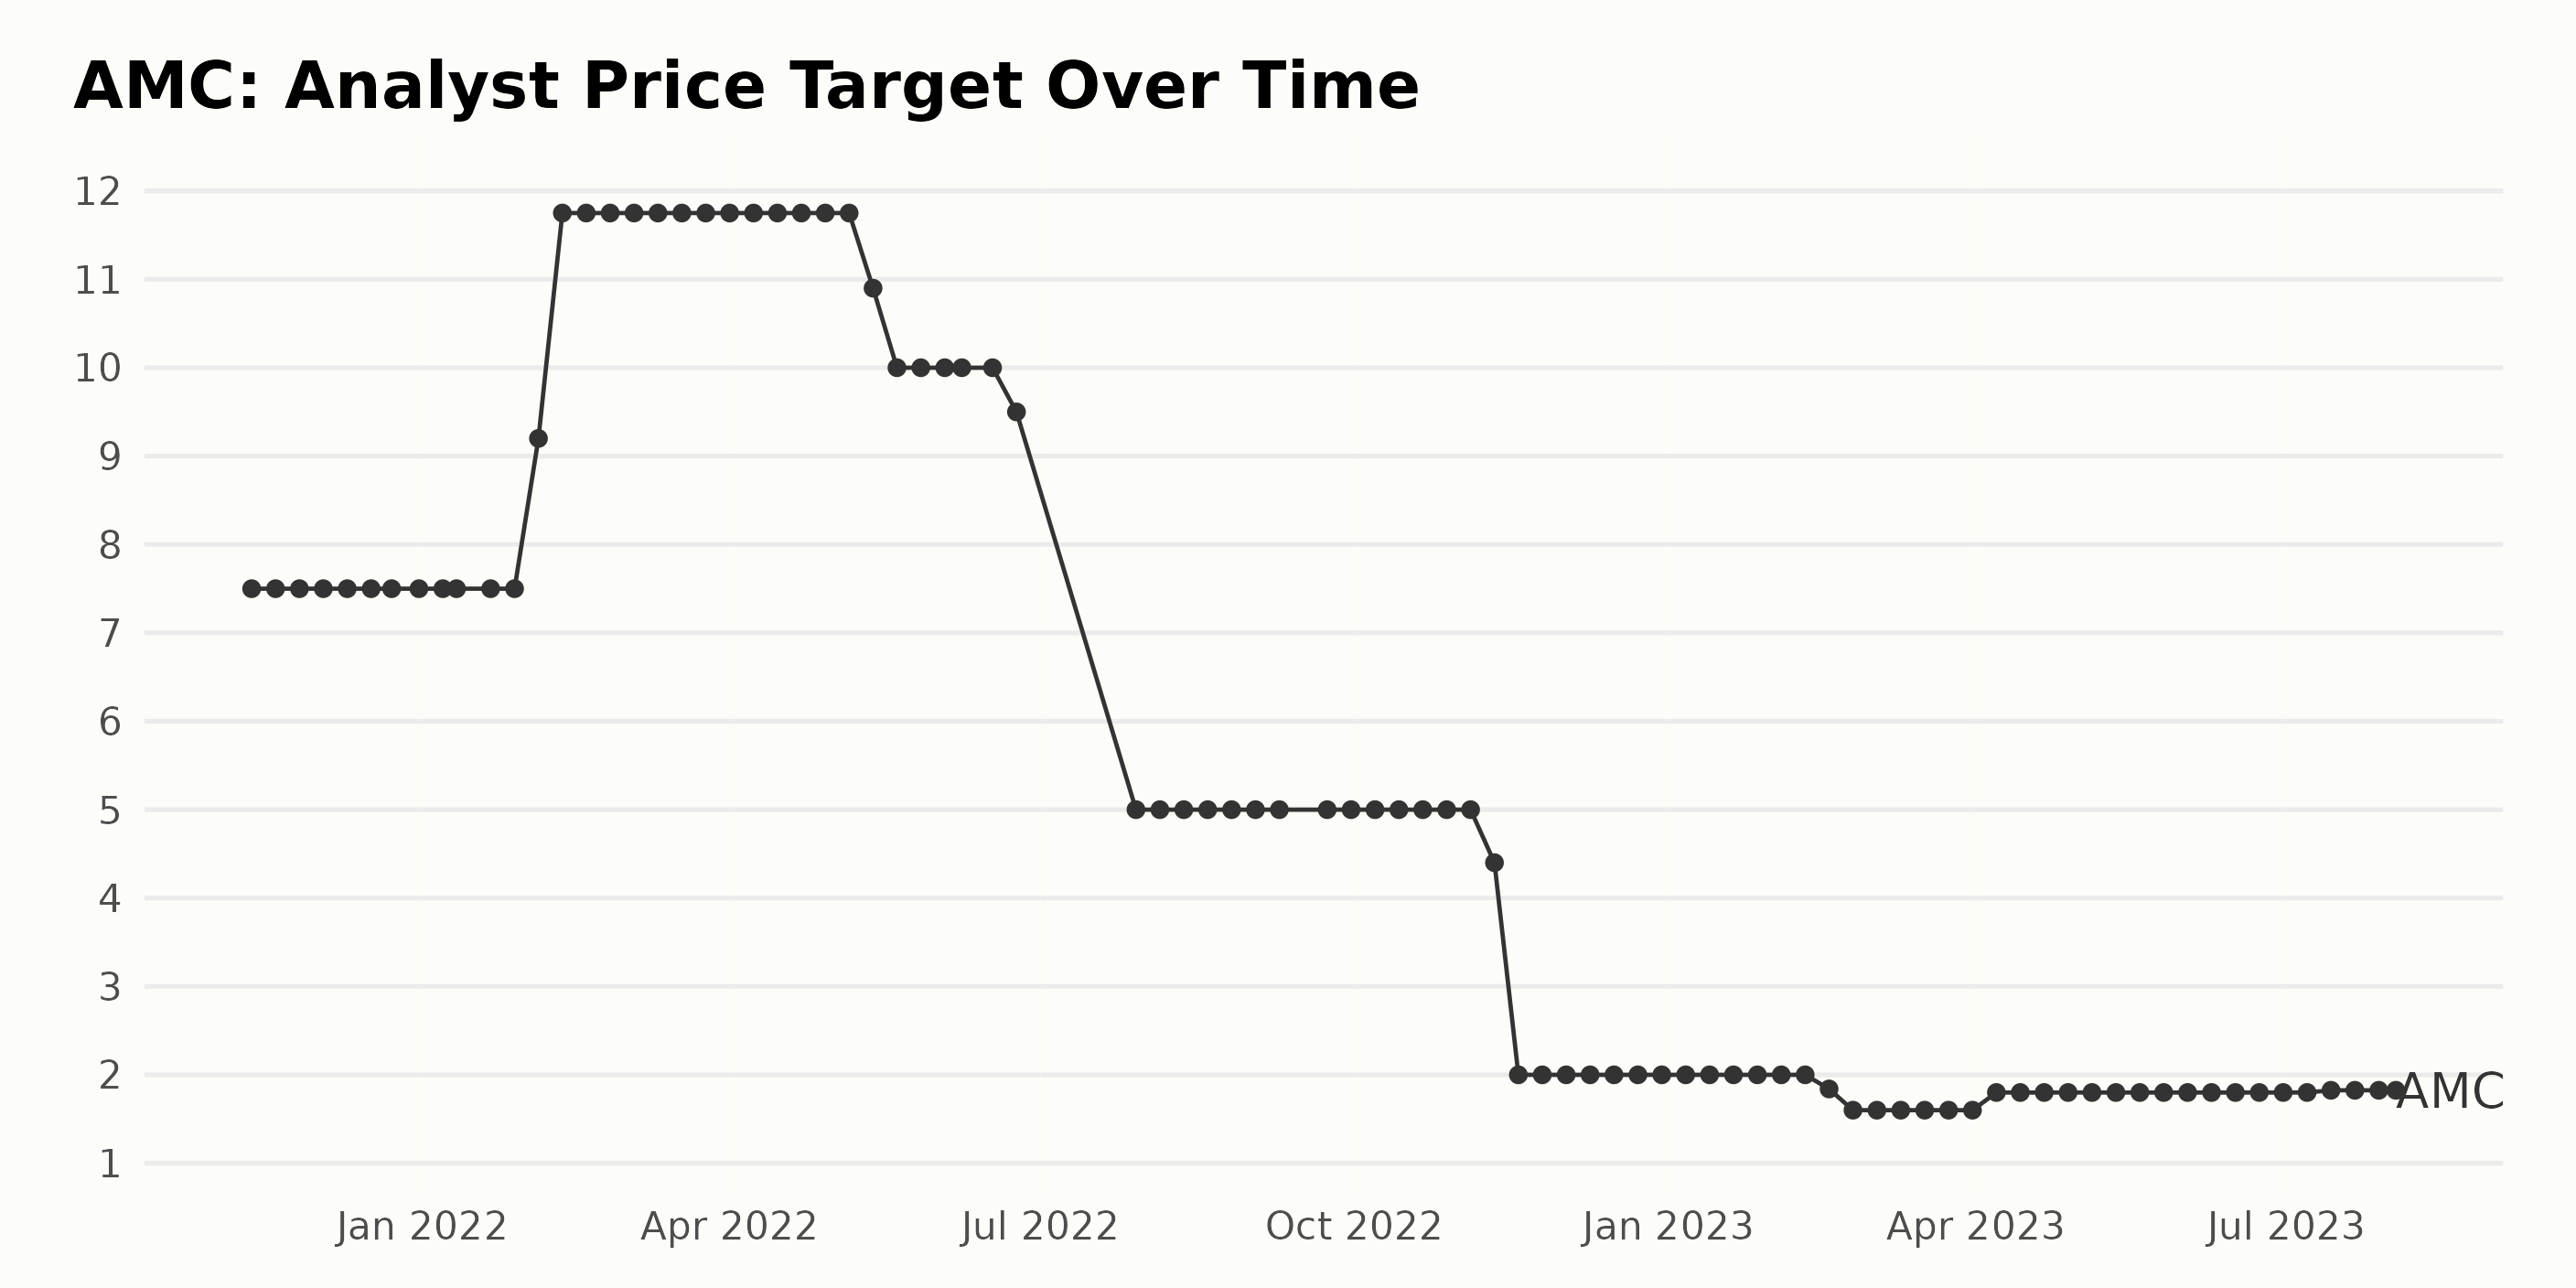
The trend and fluctuations of the analyst price target for AMC can be summarized as follows:
- From November 12, 2021, to January 28, 2022, the price target remained stable at $7.50.
- On February 4, 2022, there was a significant increase to $9.20, followed by a higher surge to $11.75 on February 11, 2022, which remained until May 13, 2022.
- A gradual decrease was observed from May 20, 2022, to June 24, 2022, with the price target falling from $10.90 to $9.50.
- A sharp drop was reported on July 29, 2022, when the price target plummeted to $5. This value remained until November 11, 2022, when it dropped to $4.40 again.
- From November 18, 2022, to February 3, 2023, the price target dropped significantly to $2.
- Between February 17, 2023, and March 10, 2023, the price target experienced another dip, reducing to $1.60.
- The pattern shifted again on April 7, 2023, when the analyst price target increased to $1.80. This figure remained until July 14, 2023.
- Lastly, a marginal increase took the figure up to $1.825 from July 14, 2023, until the endpoint on August 2, 2023.
In conclusion, the overall trend for the analyst price target of AMC over the observed period highlights a significant downward trajectory, despite a few short-term increases. Over the total period, the price target has fallen from an initial $7.5 to a final price of $1.825, representing a substantial decrease.
Analyzing Price Trends and Fluctuations for AMC Entertainment Holdings (February-August 2023)
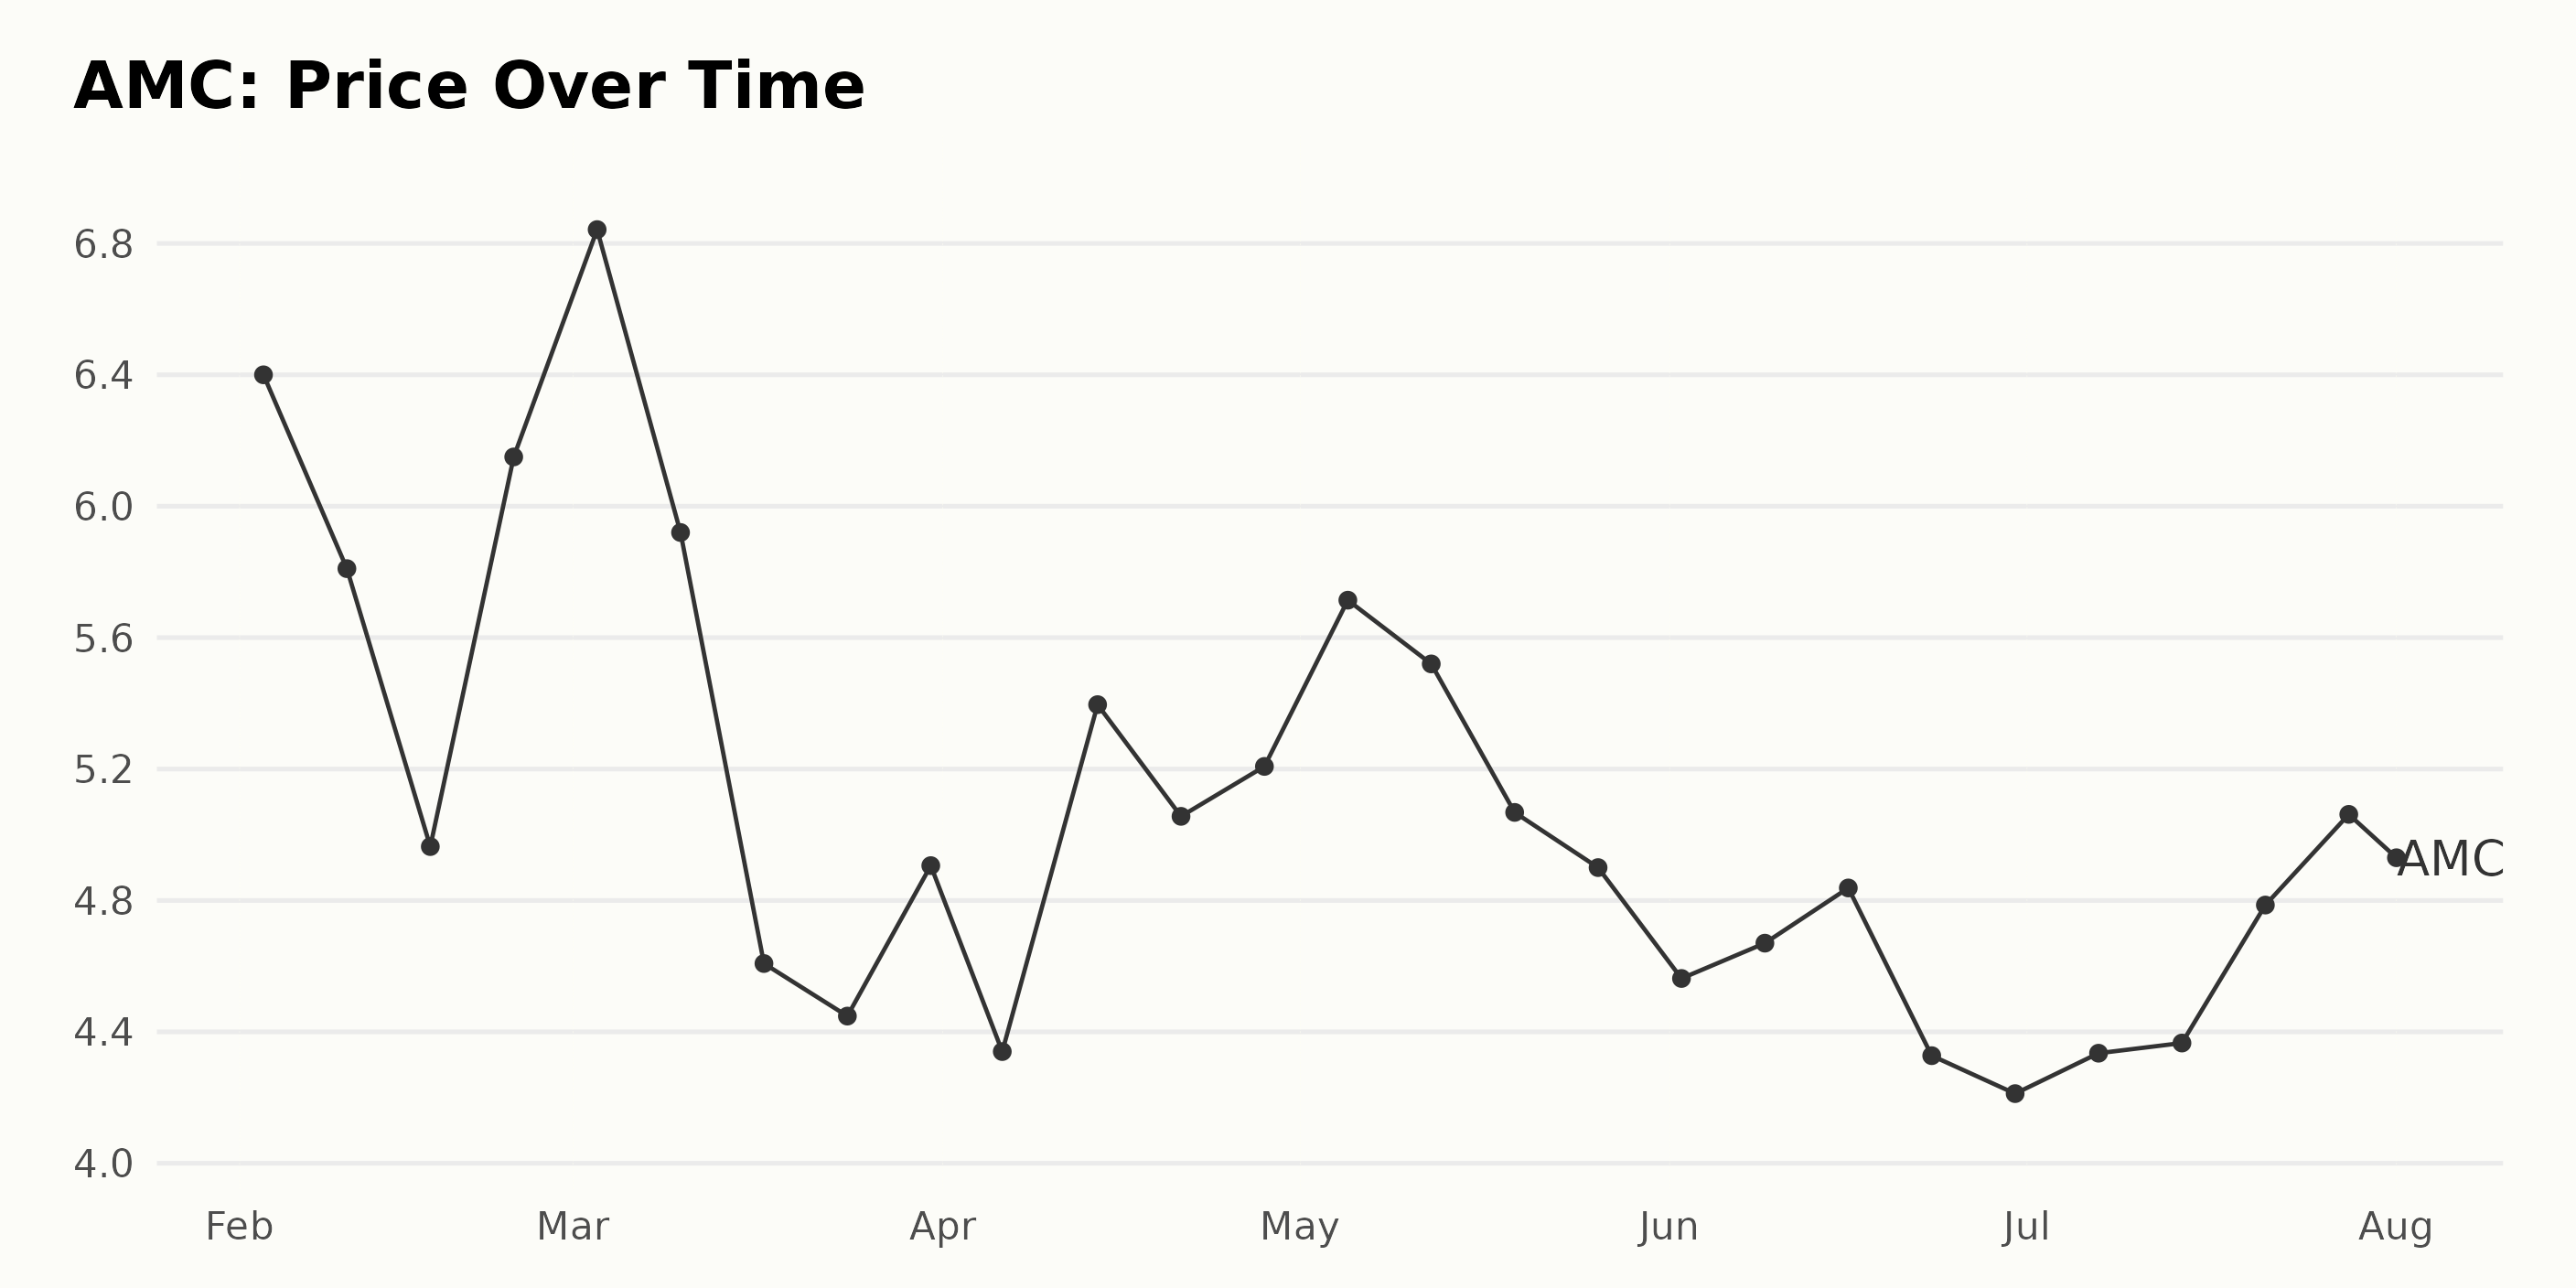
Analyzing the data, the following trend and growth rate highlights for the share price of AMC over a span of February to August 2023 can be observed:
- On February 3, 2023, the share price was $6.40. Over the course of February, the price fluctuated and dropped to $6.15 by February 24, 2023.
- In the month of March 2023, the share price had an initial peak reaching $6.84 on March 3. However, it experienced a sharp fall, declining to $4.45 by March 24. By the end of the month, the share price slightly improved, finishing at $4.91 on March 31.
- In April 2023, the price of the shares saw a slight increase, climbing from $4.34 on April 6 to $5.21 by April 28.
- May 2023 saw a moderate increase in its initial stages, with a peak at $5.71 on May 5 but experienced a gradual decrease ending with the value of $4.9 by May 26.
- The beginning of June 2023 witnessed a downward trend, with the share price falling to $4.56 on June 2, but then showed some recovery by mid-month, reaching $4.84 on June 16. Despite this, the price again decreased to $4.21 by the end of the month.
- July 2023 represented a period of relative stability with a bit of increase in the share price, starting from $4.34 on July 7 and slowly increasing to $5.06 on July 28.
- However, in the early days of August 2023, the share value decreased marginally to $4.93 on August 1.
The overall trend for AMC from February till August 2023 seems to fluctuate with both increase and decrease periods. Please note that this doesn't seem like a consistently accelerating or decelerating trend. The share prices show a mix of stability, mild increases, and decreases over the period under review. Here is a chart of AMC's price over the past 180 days.
Analyzing AMC Entertainment's Growth, Momentum, and Value Trends (2023)
The POWR Ratings grade of AMC Entertainment - Movies/Studios category of stocks, for the latest data registered on August 2, 2023, is D (Sell). Over a span of roughly six months from February 4, 2023, till August 1, 2023, AMC consistently held a D (Sell) grade in this metric.
Furthermore, reviewing the AMC's rank in its category based on the data, it mostly occupies the fifth position throughout the observed period. It can be inferred that AMC's performance has been less than stellar compared to its peers.
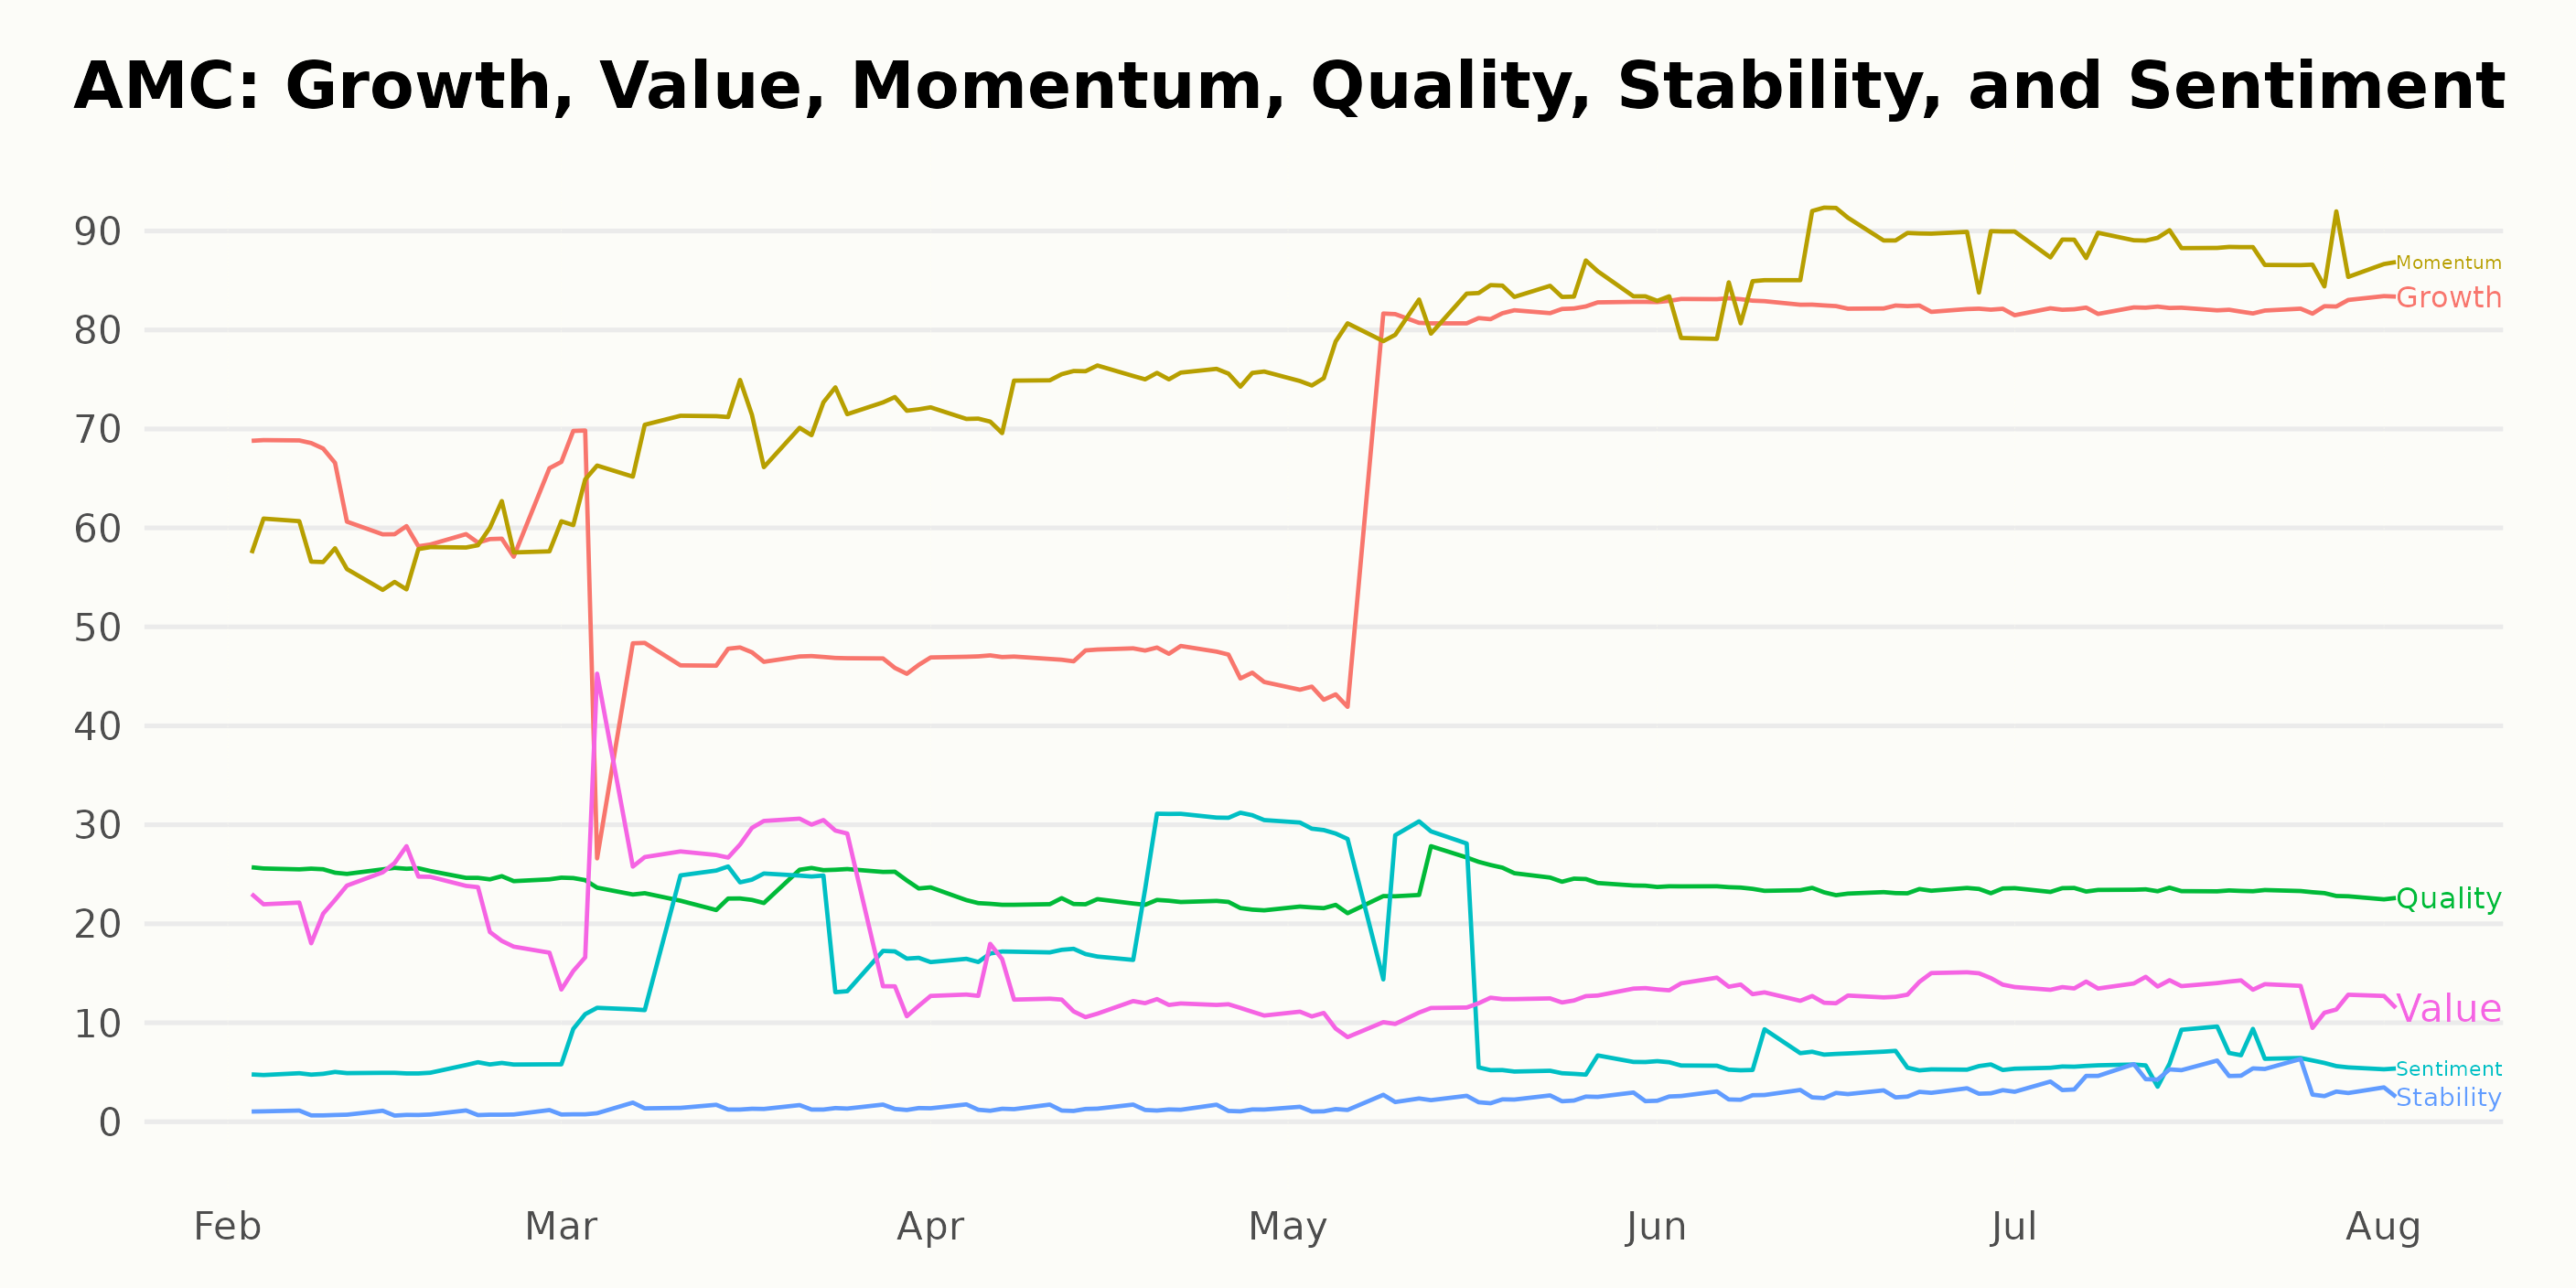
Based on the POWR Ratings, AMC's three most noteworthy dimensions are Growth, Momentum, and Value.
Growth: This dimension has quite an exciting trajectory over the span of six months, observed from February to August 2023. Starting at a rating of 62 in February, it dropped to its lowest point of 47 in April before rebounding and consistently remaining above 80 from June onwards. The highest growth point was observed in June, with significant growth sustained till the last recorded date in August 2023.
Momentum: AMC's momentum appears to be building continuously throughout the period. Starting from a value of 58 in February 2023, there is a clear upwards trend, with the Momentum rating reaching the high 80s by July and maintaining that level through August 2023. This indicates a strong momentum drive within AMC during this period.
Value: This dimension showed a varied trend over the observed period. The value began at 22 in February 2023, increased slightly until reaching a peak of 24 in March, and then steadily declined to 12 in May. It then remained somewhat stable around the mid-teens range for the rest of the observation period.
These dimensions provide a comprehensive overview of AMC’s Growth, Momentum, and Value as indicators of its potential performance.
How does AMC Entertainment Holdings, Inc. (AMC) Stack Up Against its Peers?
Other entertainment stocks that may be worth considering are Imax Corporation (IMAX), International Game Technology PLC (IGT), and Playtika Holding Corp. (PLTK) - they have better POWR Ratings.
43 Year Investment Pro Shares Top Picks
Steve Reitmeister is best known for his timely market outlooks & unique trading plans to stay on the right side of the market action. Click below to get his latest insights…
Steve Reitmeister’s Trading Plan & Top Picks >
AMC shares were trading at $4.73 per share on Wednesday afternoon, down $0.20 (-4.06%). Year-to-date, AMC has gained 16.22%, versus a 18.68% rise in the benchmark S&P 500 index during the same period.
About the Author: Anushka Dutta

Anushka is an analyst whose interest in understanding the impact of broader economic changes on financial markets motivated her to pursue a career in investment research.
The post Does AMC Entertainment Holdings (AMC) Have Any Growth or Momentum in Its Future? appeared first on StockNews.com