


Royal Caribbean Cruises Ltd. (RCL) raised its full-year outlook following its robust second-quarter performance, as pent-up demand boosts cruise companies’ prospects. The company reported a second-quarter adjusted EPS of $1.82, topping expectations of $1.55. Following this, RCL raised its annual adjusted profit outlook to $6.00-$6.20 per share.
On the other hand, although cruise vacations have been popular for customers looking to enjoy cheaper travel, cruise companies have signaled to raise their itinerary prices as occupancy approaches pre-pandemic levels.
Given this backdrop, let’s look at the trends of RCL’s key financial metrics to understand why it could be wise to watch and wait for a better entry point in the stock.
Analyzing Financial Trends and Performance of Royal Caribbean Cruises Ltd. from 2020 to 2023
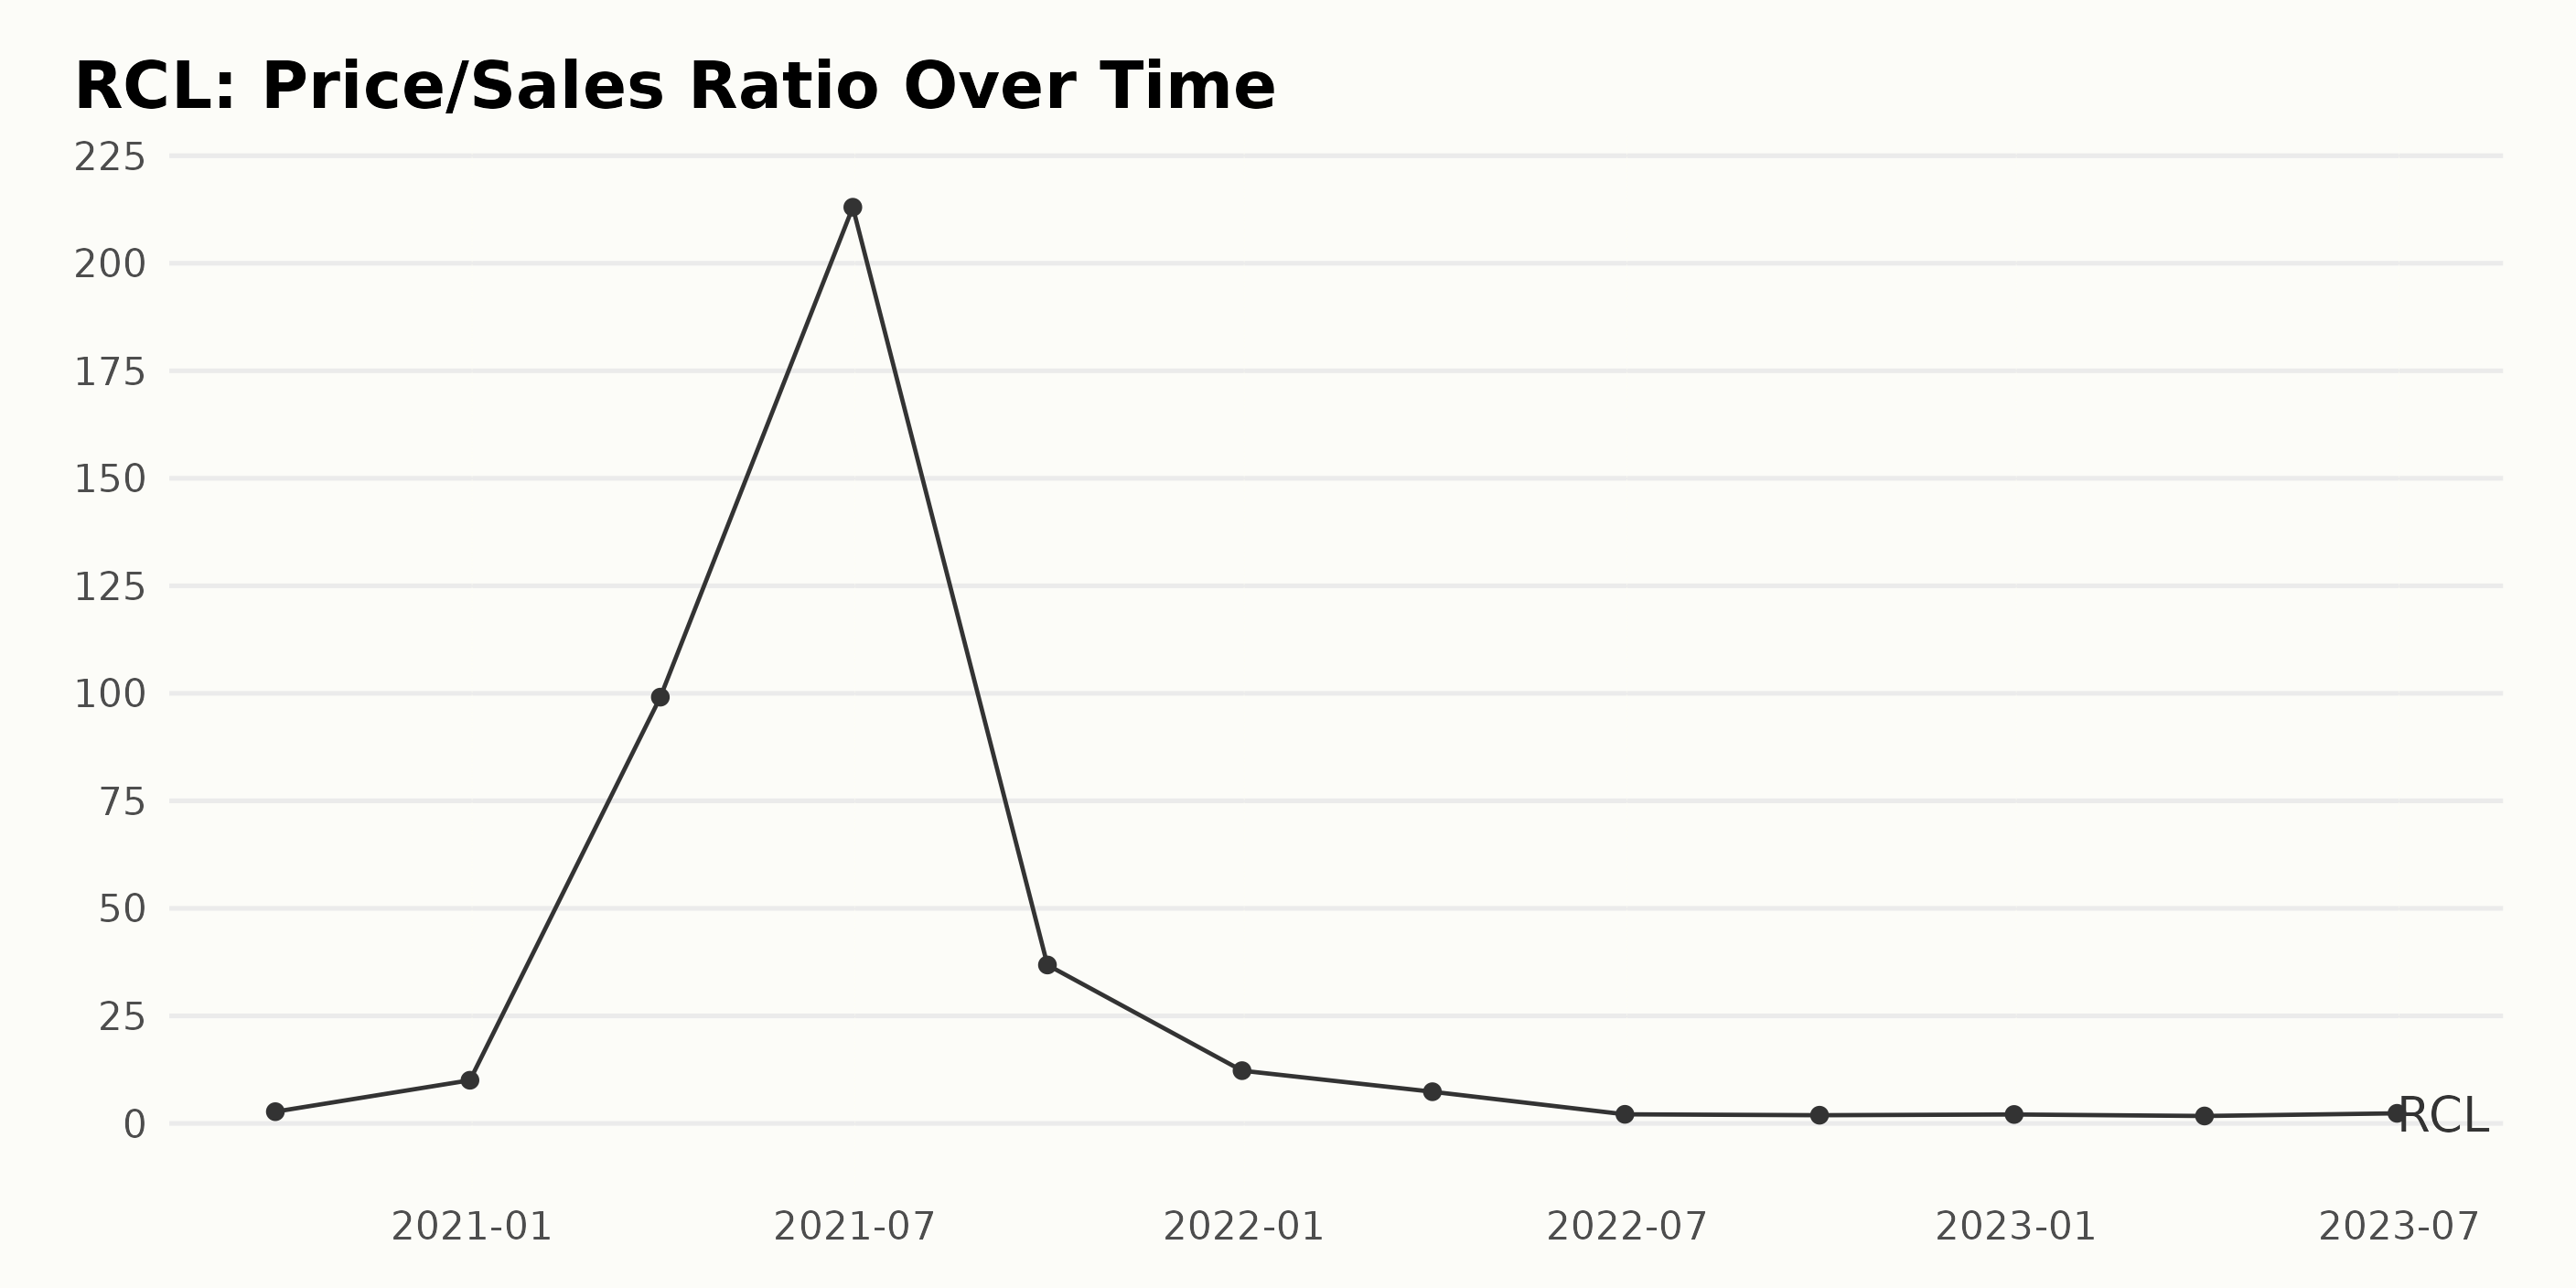
The Price/Sales ratio (P/S) of RCL has demonstrated significant volatility and noticeable trends from September 2020 to June 2023.
- From September 30, 2020, to March 31, 2021, there was a dramatic increase in the P/S, starting at 2.72 and peaking at 99.11. This represents a growth rate of approximately 3,542% over this six-month period.
- An even steeper decline followed this surge until it reached a low value of 2.11 on June 30, 2022. This constitutes about a 98% decrease from its previous peak, indicating severe fluctuations over a span of around 15 months.
- Following this low point, the P/S had a slight resurgence, peaking again at 2.34 on June 30, 2023, which still signifies a decrease of about 76% compared to the initial value on September 30, 2020.
In terms of more recent data, from June 30, 2022, onwards, the company's P/S shows signs of stabilizing, hovering around 2 with minor fluctuations. As of the last value in the series, on June 30, 2023, the P/S stood at 2.34, showing only a relatively small increase compared to the preceding year.
The current P/S indicates a considerable decrease of around 97% compared to its highest point on June 30, 2021. These trends suggest a possibly stabilizing market for RCL moving forward, but further observation would be needed given the significant past volatility.
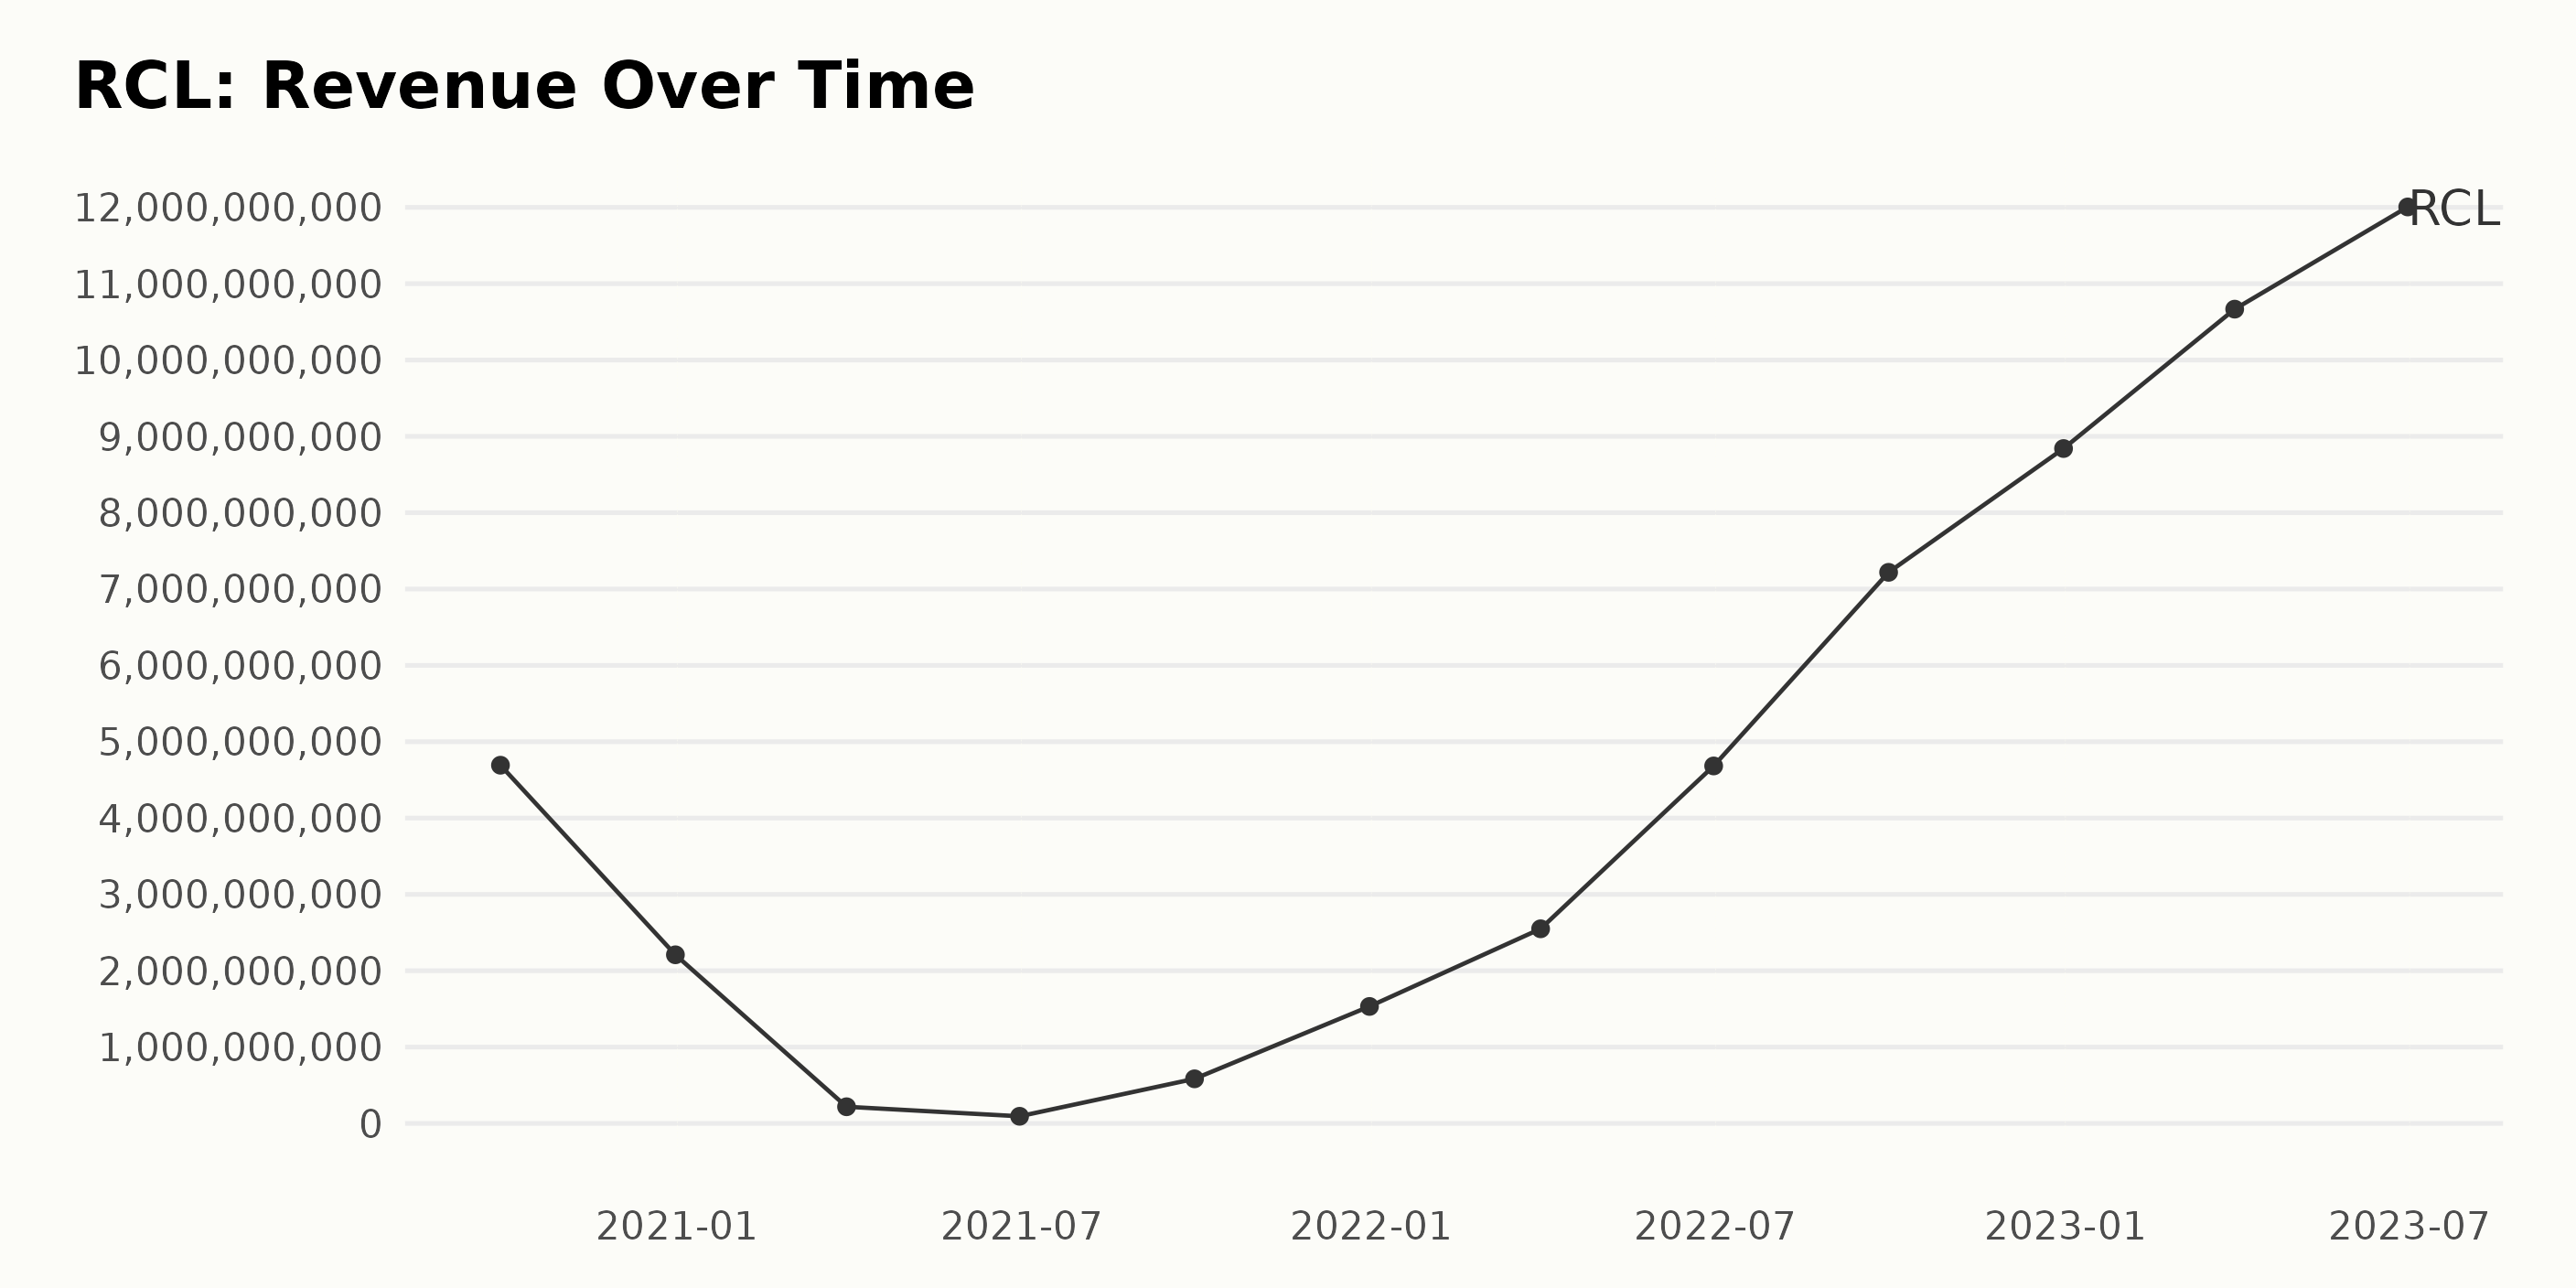
The trend of RCL's trailing-12-month revenue has seen notable fluctuations over the years and is currently on an upward trajectory.
- On September 30, 2020, RCL's revenue was $4.69 billion.
- By December 31, 2020, it decreased notably to $2.21 billion.
- In the first quarter of 2021, the decrease continued where revenue plummeted to just $218.07M by March, and by June, it had dipped further to a low of $93.38 million.
- A slight recovery occurred by the end of the third quarter in September with $584.02 million.
- By the end of 2021, there was a significant increase to $1.53 billion.
This upward trend continued into 2022,
- In the first quarter of 2022, revenue ramped up to $2.55 billion, and by the end of June, it had nearly doubled to $4.68 billion.
- Buoyancy persisted into the third quarter reaching $7.22 billion and closed out at an all-time high of $8.84 billion in December.
Progressing into 2023, the growth trend remained consistent, if not more accelerated:
- Revenue leaped to $10.67 billion by the end of March and kept ascending, closing at $12.01 billion by the end of June.
The growth rate - measured from September 30, 2020, when revenue was $4.69 billion, to June 30, 2023, when it was $12.01 billion - indicates a significant boost in the company's performance.
The gross margin trends for RCL have seen significant fluctuations over the given period:
- On September 30, 2020, the gross margin was recorded at 15.1%.
- However, by December 31, 2020, the margin had plummeted to a negative value of -25.2%, marking a relentless downward shift.
- This negative trend in gross margin extended into 2021, plummeting to a dramatic low of -605.2% and -1,273.1% by the end of March and June, respectively.
- In the subsequent quarter ending on September 30, 2021, we noticed a significant recovery to -206%. The year ended with a relatively less severe negative gross margin of -73.5% as of December 31, 2021.
- The trend showed encouraging signs of improvement in 2022. By March 31, it minimized the loss to -39.6%, June 30 saw it further reduced to -3%, and by September 30, it rose positively to reach 17.3%.
- As per the most recent data, on December 31, 2022, the gross margin is now positive, sitting at 25.2%, and has continued to grow into 2023, with March seeing 32.3% and then followed by June seeing an all-time high of 37.6%.
Thus, after a period of immense struggle with significant losses, RCL's gross margin has shown steady improvement, concluding with a strong positive growth rate of 22.5 percentage points from the first recorded value.
This illustrates a commendable turnaround. It's notable that this progression has taken place despite continued market challenges, making it a primary highlight in RCL’s recent financial performance.

The trend and fluctuations of the current ratio of RCL from September 2020 to June 2023 can be broadly summarized as follows:
- The current ratio originally started at 0.76 in September 2020.
- There was a significant peak of 1.70 in March 2021, the highest value throughout the reported period.
- Following this peak, the ratio experienced a general downward trend, with minor fluctuations in between.
- The ratio took a nosedive in 2022, falling from 0.49 in December 2021 to 0.29 in September 2022.
- Although there was a marginal recovery to 0.37 by the end of 2022, the downward trend continued into 2023, with the current ratio reaching a low of 0.20 by June.
Overall, between September 2020 and June 2023, the current ratio of RCL decreased significantly by approximately 73.68%, suggesting increased financial risk for the company over the period.

Analyzing the Six-Month Volatility and Growth Trend of Royal Caribbean Shares
The price trend and growth rate for RCL showed significant fluctuations over the period of time covered in the dataset, from late February to mid-August 2023.
- Starting in February 2023 with a share price of $71.32, RCL's stock value remained relatively stable in early March, peaking slightly at $71.74 on March 3 before dipping slightly to $71.46 on March 10.
- From mid to late March, there was a marked deceleration in the company’s shares, moving from $63.53 on March 17 to $61.92 on March 24. Although it attempted to recover with a slight increase to $63.31 by the end of the month, it continued to fall steadily through early April, with the lowest price of this period being $62.24 on April 14.
- From May to June, we witnessed a clear rising trend where the stock rallied, climbing from $69.95 on May 5 to an impressive peak of $101.32 by the end of June, indicating a significant growth spike within just two months.
- The shares continued to demonstrate volatility in July, fluctuating between $100.18 and $102.64. However, by late July and early August, the share price enjoyed another surge, reaching its peak of $106.16 on August 4 before retracting slightly to stand at $99.53 on August 17.
This six-month trend suggests an overall growth pattern for RCL’s share value, despite significant peaks and troughs throughout the period. The stock demonstrated resilience against its earlier downward turns and showed a capability to lift its market value significantly within relatively short periods.
Over time, despite the fluctuations, the general trend has been accelerating upward growth. Here is a chart of RCL's price over the past 180 days.

Royal Caribbean Demonstrates Significant Growth, Momentum, and Quality Improvement
The POWR Ratings grade of RCL, which operates in the Travel - Cruises category of stocks, has shown a degree of fluctuation over time based on the provided data. This category contains a total of four stocks.
- From late February to mid-April 2023, RCL maintained a consistent POWR grade of D (Sell). In terms of its rank within its category, there was a slight improvement from the #2 position to the #1 between April 15 and April 22, 2023.
- However, by the end of April 2023, RCL's performance had slightly declined, with its ranking dropping to the #2 position, maintaining a POWR grade of D (Sell).
- Starting from May 6, 2023, RCL's POWR grade improved to a C (Neutral), with its rank in the category oscillating between the #1 and #2 positions until early August 2023.
- Notably, from August 5, 2023, RCL seemed to maintain a steady level of performance, holding onto a POWR grade of C (Neutral) and standing firmly at the #1 position within its category.
The latest available data indicates that as of August 18, 2023, RCL still holds onto a POWR Grade of C (Neutral) and prominently sits at the #1 rank within its category.
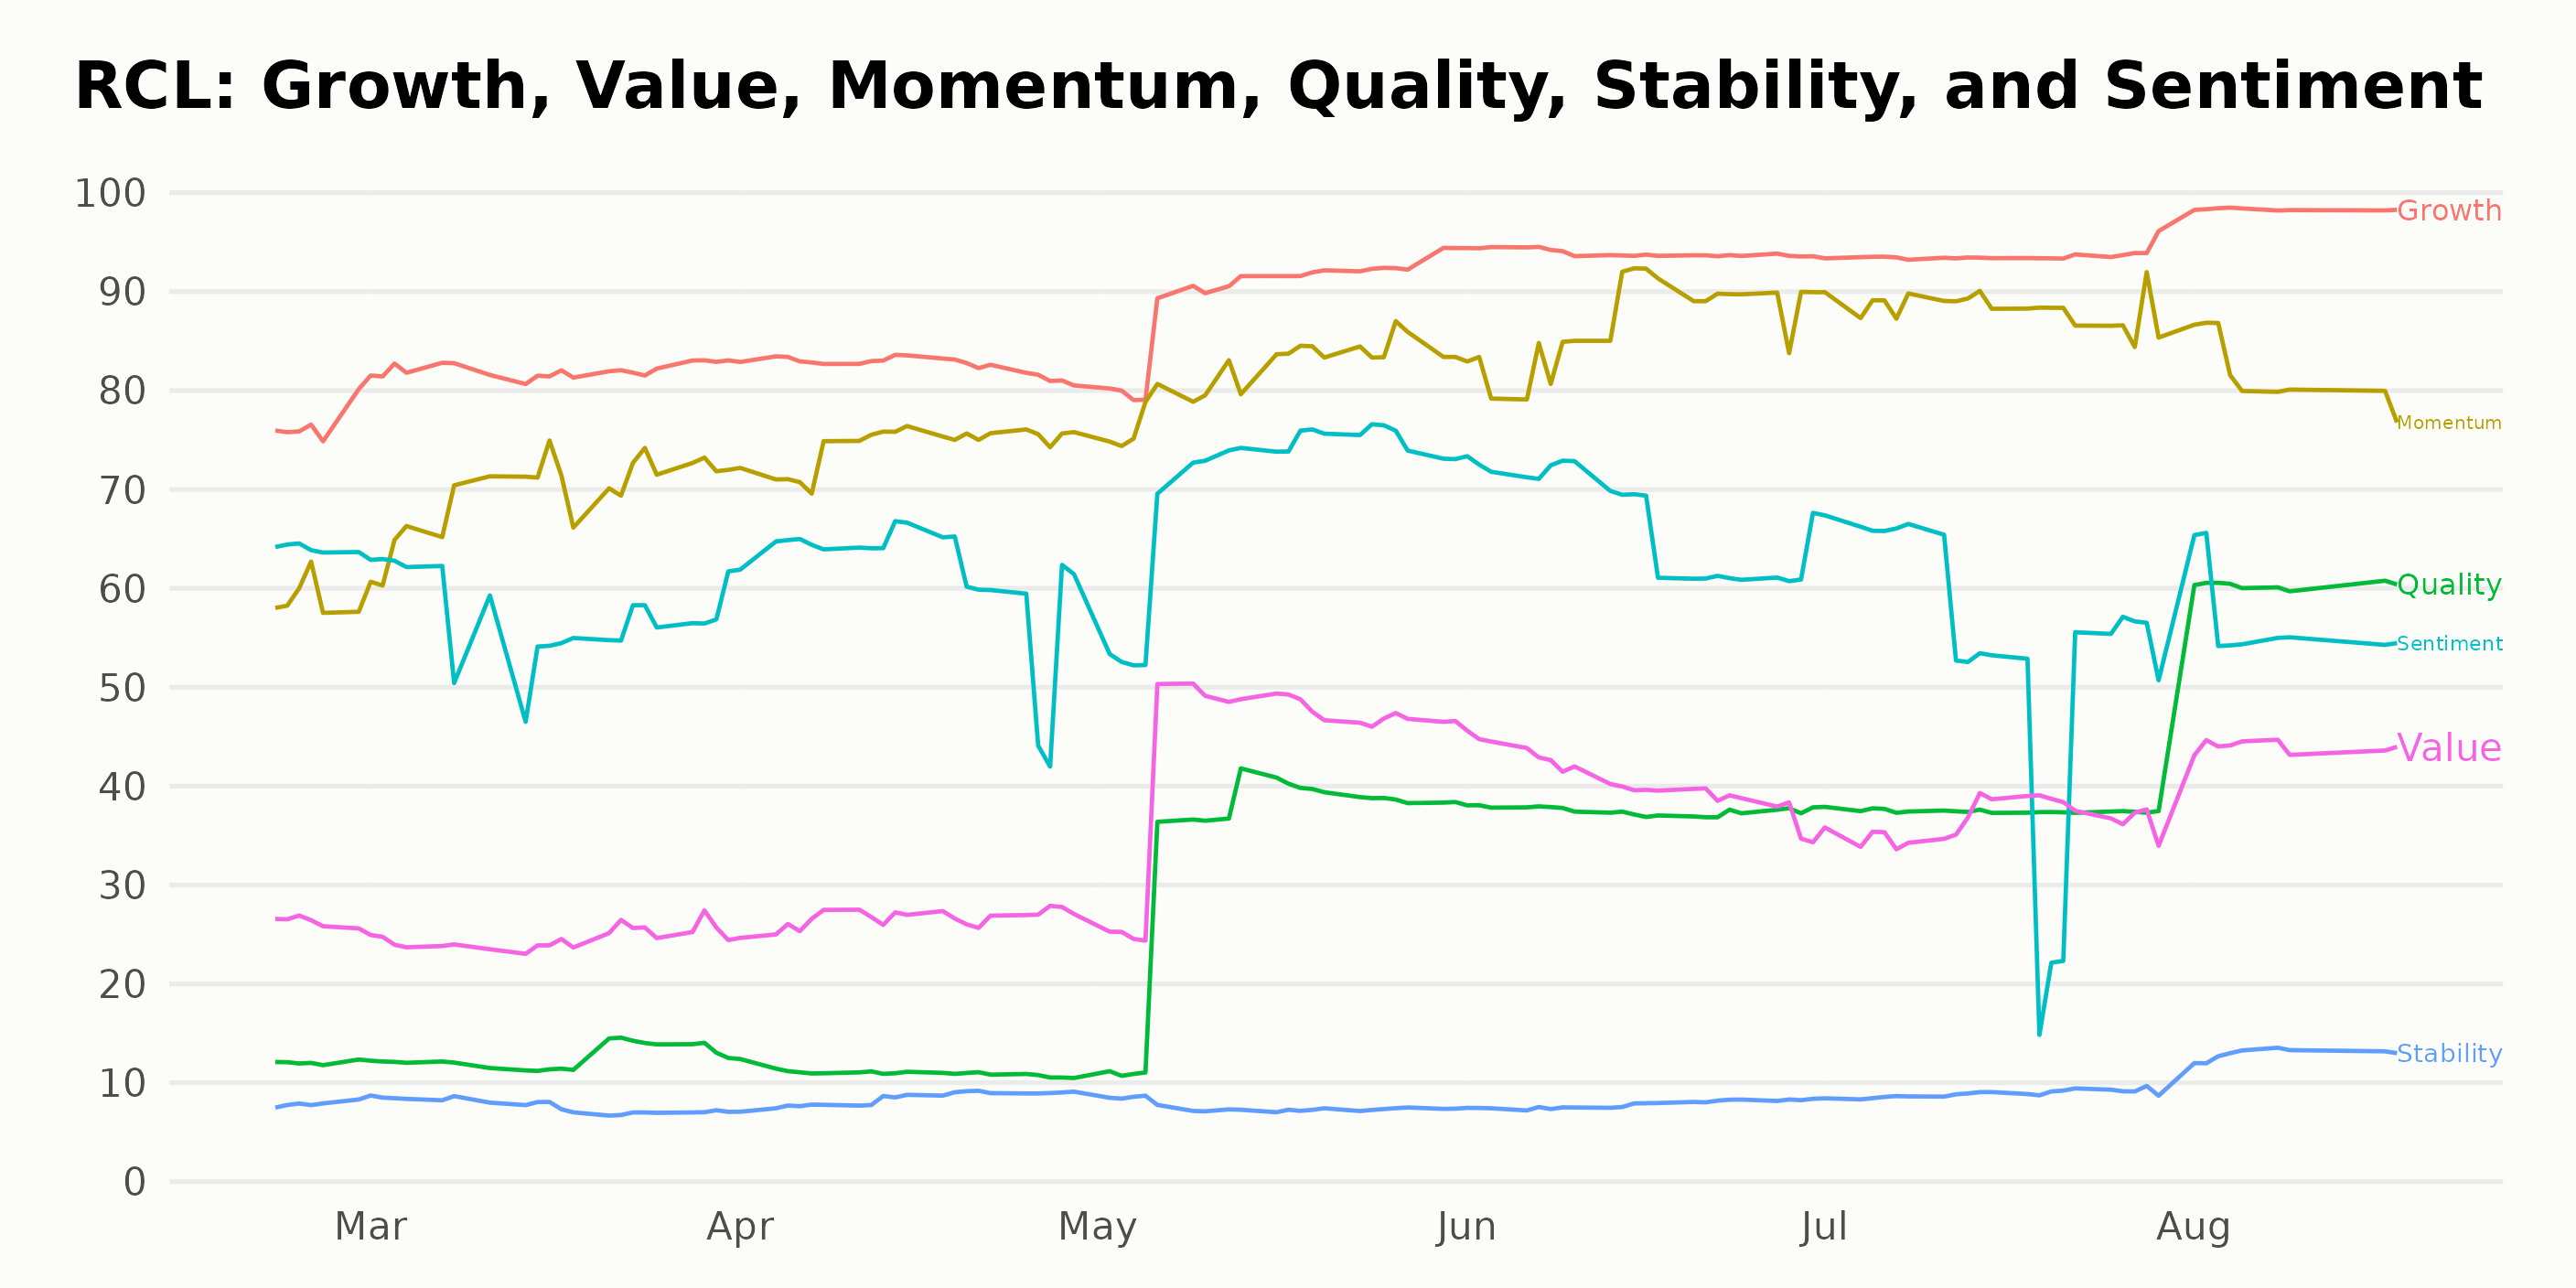
Reviewing RCL's POWR Ratings across the six dimensions, we identify the three most noteworthy dimensions: Growth, Momentum, and Quality.
Growth: The Growth dimension exhibited a gradual upward trend from February to August 2023. In February, RCL's score in the Growth dimension was 77, which increased significantly to 98 by August. This demonstrates a strong growth trajectory for RCL within this timeframe.
Momentum: RCL has also sustained a strong momentum throughout the time period. Starting at 59 in February, the momentum score escalated to 82 by August. This is indicative of a robust upward trend in momentum.
Quality: While Quality initially held a low rating, an improvement occurred from May 2023 onwards. Initially, in February, it had a score of only 12, increasing slowly until April, when it was rated 11. Then, during May, it leaped to 33, maintaining continual progression till August, where it reached a score of 60.
In conclusion, RCL showed remarkable performance in Growth and Momentum and conspicuous improvements in Quality over the evaluated period. It demonstrates a strong position and potential in those aspects of the business.
How does Royal Caribbean Cruises Ltd. (RCL) Stack Up Against its Peers?
Other travel stocks that may be worth considering are Bluegreen Vacations Holding Corporation (BVH), Genting Berhad (GEBHY), and Travel + Leisure Co. (TNL) - they have better POWR Ratings.
43 Year Investment Pro Shares Top Picks
Steve Reitmeister is best known for his timely market outlooks & unique trading plans to stay on the right side of the market action. Click below to get his latest insights…
Steve Reitmeister’s Trading Plan & Top Picks >
RCL shares were trading at $99.69 per share on Friday morning, up $0.16 (+0.16%). Year-to-date, RCL has gained 101.68%, versus a 14.98% rise in the benchmark S&P 500 index during the same period.
About the Author: Anushka Dutta

Anushka is an analyst whose interest in understanding the impact of broader economic changes on financial markets motivated her to pursue a career in investment research.
The post Royal Caribbean Cruises Ltd. (RCL): Is This a Cruise Line Stock Worth Watching? appeared first on StockNews.com