


Taiwanese chip giant Taiwan Semiconductor Manufacturing Company Limited (TSM) is pushing into overseas manufacturing, eyeing Japan as a suitable production base following its struggle to recruit workers for its Arizona facility. The company’s $8.6 billion under-construction Japanese hub is expected to start production in 2024.
Although the company is in talks with the Arizona government to attract more investment and address some challenges the company has faced in the state, the Arizona hub is anticipated to be delayed until 2025 due to a lack of specialty workers.
Moreover, for the second quarter, TSM’s revenue and net income dropped from their prior-year period values as the company was impacted by macroeconomic pressures. For the third quarter, while the company expects support from its 3-nanometer technologies, customers’ inventory adjustment could partially offset that gain.
Given this backdrop, let’s look at the trends of TSM’s key financial metrics to understand why it could be wise to wait for a better entry point in the stock.
Assessing Financial Performance: A Deep Dive into Taiwan Semiconductor Manufacturing
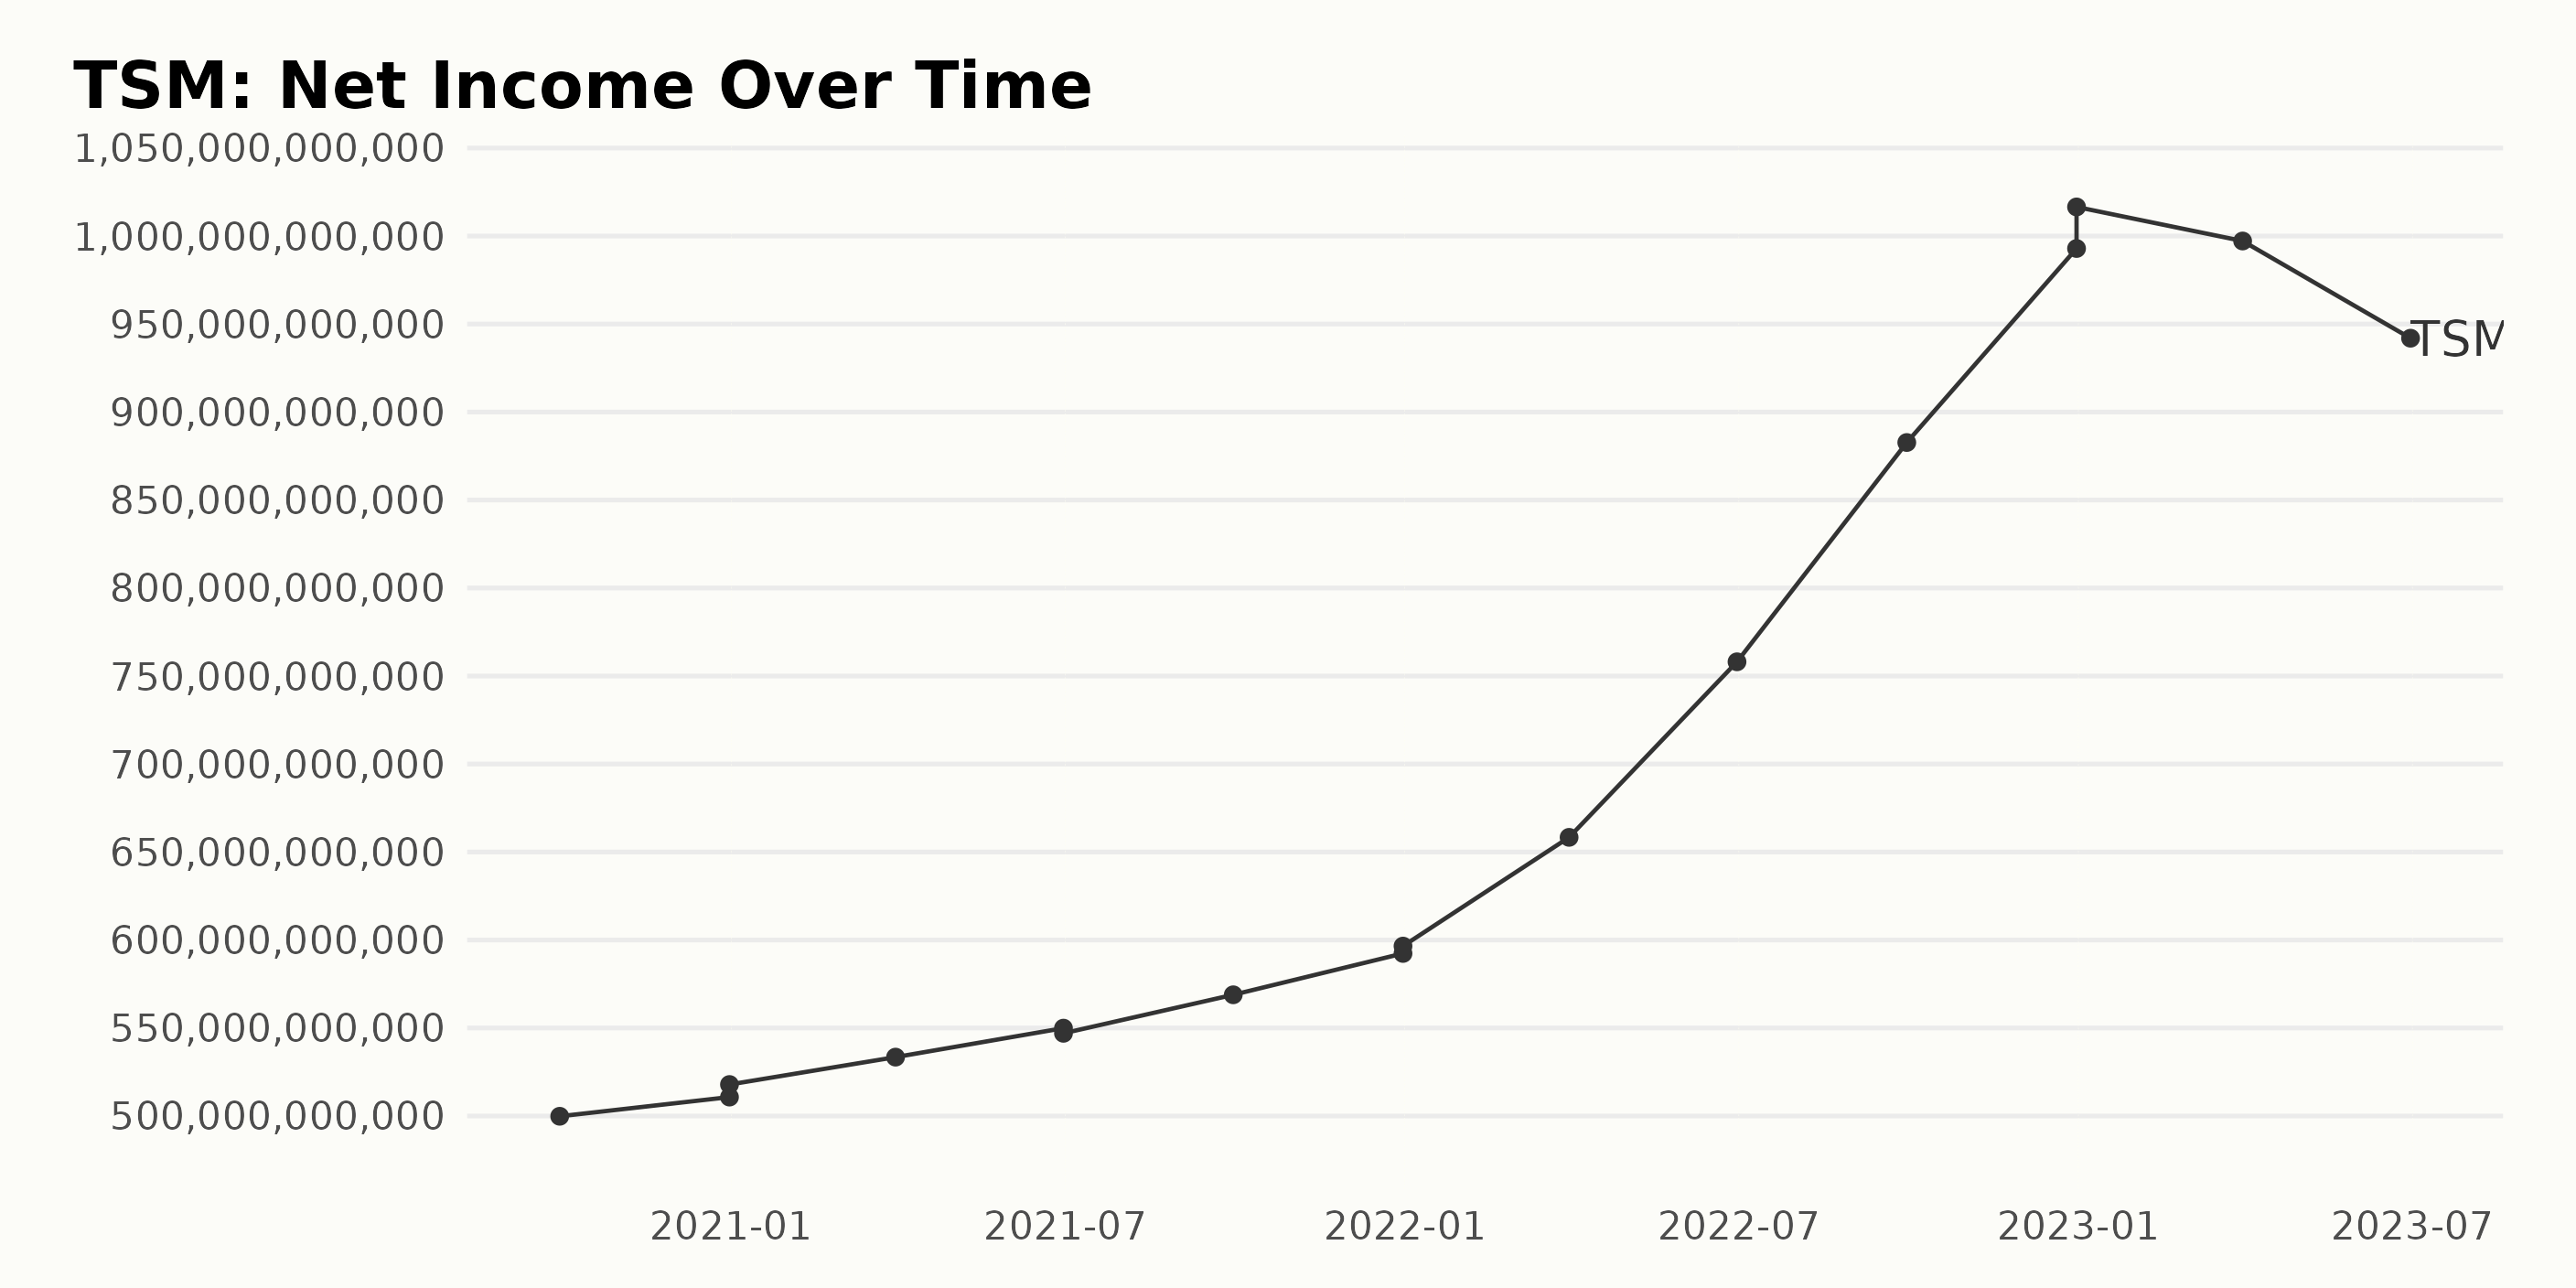
The trailing-12-month net income of TSM has demonstrated a positive trend over the observed time frame, growing from $499.84 billion in September 2020 to $941.95 billion in June 2023. Key points:
- Between September 2020 and December 2020, TSM experienced a minor growth in net income from $499.84 billion to $517.89 billion.
- From December 2020 to June 2021, the net income saw consistent yet slow growth, moving from $517.89 billion to $549.92 billion.
- The growth accelerated in September 2021, reaching $568.86 billion, which continued to climb, reaching $596.54 billion by the end of December.
- Significant growth was witnessed during 2022, with net income peak reaching $1.01 trillion in December 2022.
- However, the first half of 2023 marked a downturn, with net income falling back to $941.95 billion in June 2023 after a minor drop at $997.17 billion in March 2023.
Overall, TSM's net income has experienced an upward trend with steady growth patterns. However, the latter six months have seen some instability, with a significant dip observed. The growth rate from the first reported value to the last stands at approximately 88.45%, indicating a substantial increase over these years.
It should be noted that while the company's profitability witnessed robust growth for the majority of the period, the recent dip suggests the need for enhanced focus on this aspect.
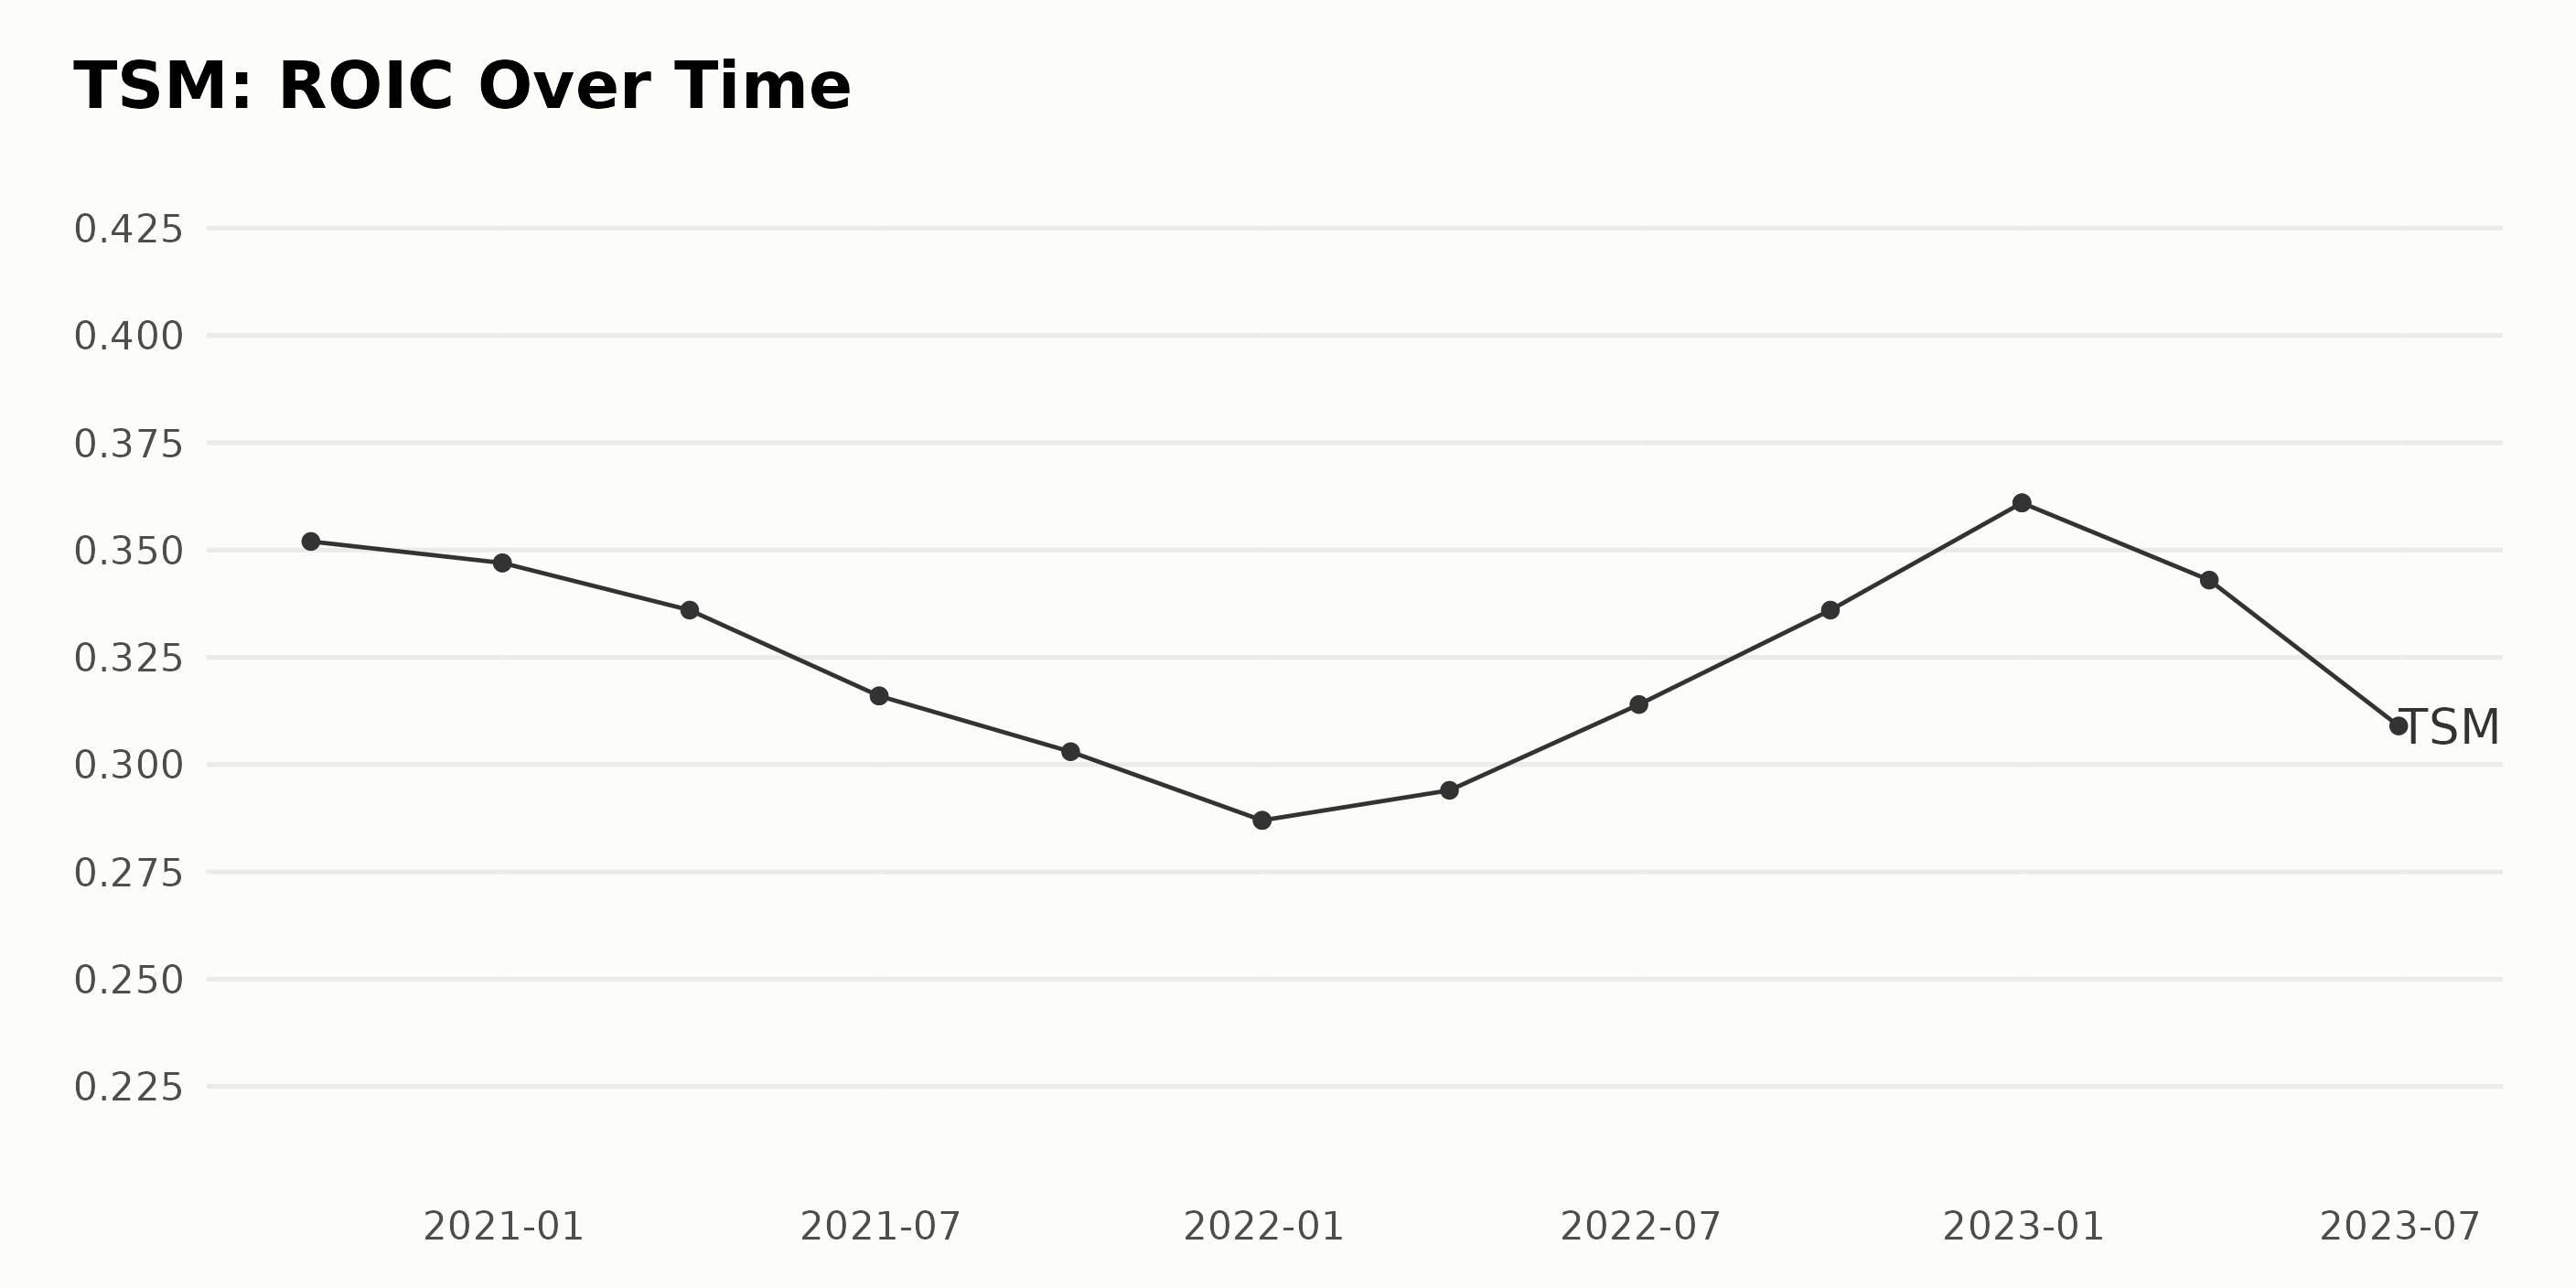
The reported Return On Invested Capital (ROIC) of TSM has demonstrated varying trends and fluctuations over the years spanning from September 2020 through June 2023. Key Observations:
- Starting in September 2020, TSM's ROIC stood at 35.2%.
- For the rest of 2020 and through the close of the first quarter of 2021, it undertook a gradual decline, moving from a value of 34.7% (December 2020) to 33.6% (March 2021).
- Throughout the second and third quarters of 2021, TSM noted a further drop-down in ROIC values, signifying a decrease from 31.6% (June 2021) to 30.3% (September 2021).
- A steeper decline for TSM was seen by the end of 2021, with an ROIC down to 28.7%. However, starting from the beginning of 2022, an upward rebound was observed.
- This resurgence was illustrated by an increase from 29.4% (March 2022) to 36.1% as of December 2022, depicting the highest figure reached since data collection.
- Though there was a slight dip again to 34.3% in March 2023, as of June 2023, the ROIC stands at 30.9%, demonstrating an overall growth rate.
Based on measurements from the first value to the last, the calculated growth rate amounts to a -4.3% from 35.2% in September 2020 to 30.9% in June 2023. Despite the fluctuations, the data suggests a slight downward trend in TSM's ROIC over the period being reviewed, with minor recoveries along the line.
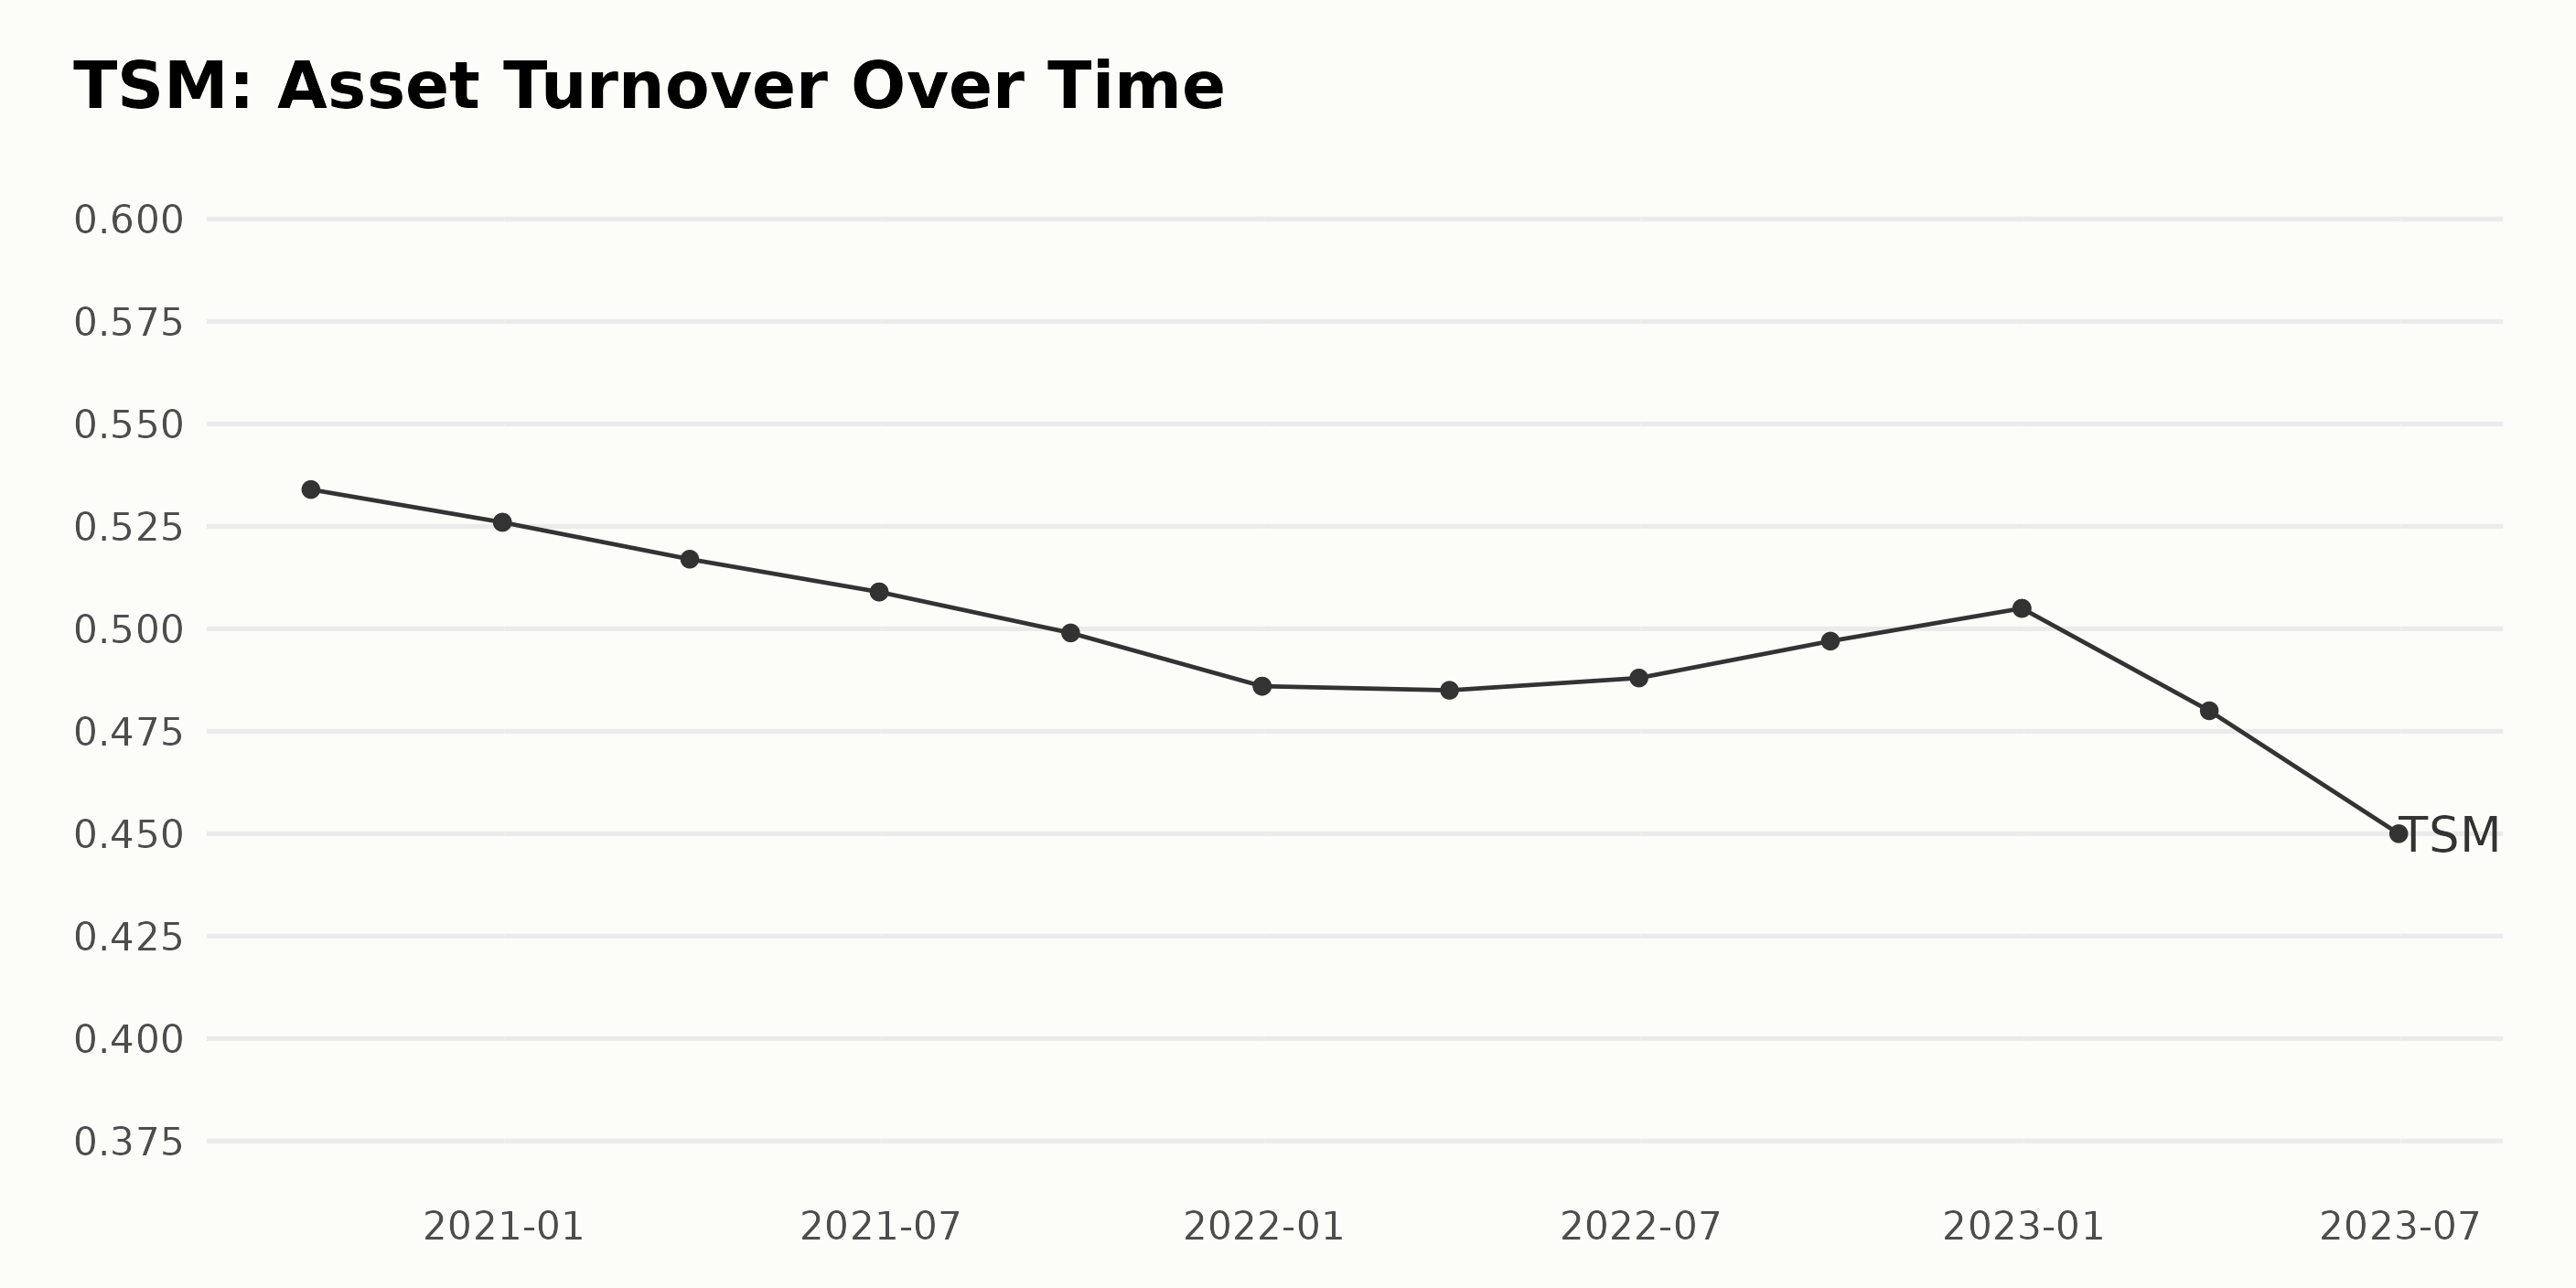
The asset turnover of TSM shows a fluctuating trend over the observed period from September 2020 to June 2023.
- Starting at 0.53 in September 2020, the asset turnover experienced a slight decline by the end of 2020 to 0.53 (recorded twice).
- In the first half of 2021, the asset turnover continued to decline slightly, registering 0.52 in March 2021 and 0.51 in June 2021. This figure was recorded twice, further stressing this downward trend.
- The latter half of 2021 showed a continued drop, with values decreasing to 0.50 and then 0.49 in September 2021.
- The year 2022 kicked off a slow reversal of this trend, starting with an asset turnover of 0.49 in March. Subsequent quarters recorded a gradual but persistent hike, reaching 0.51 (recorded twice) by the end of the year.
- The upward swing saw an abrupt halt in 2023, when asset turnover dipped first to 0.48 in March and then as low as 0.45 in June, marking the lowest value in the series.
Over the entire period, the asset turnover fell by approx. 16%, measured by comparing the first value in September 2020 (0.53) to the last record in June 2023 (0.45). Greater emphasis is placed on the recent decline in 2023, suggesting the potential for lower operational efficiency in the future.
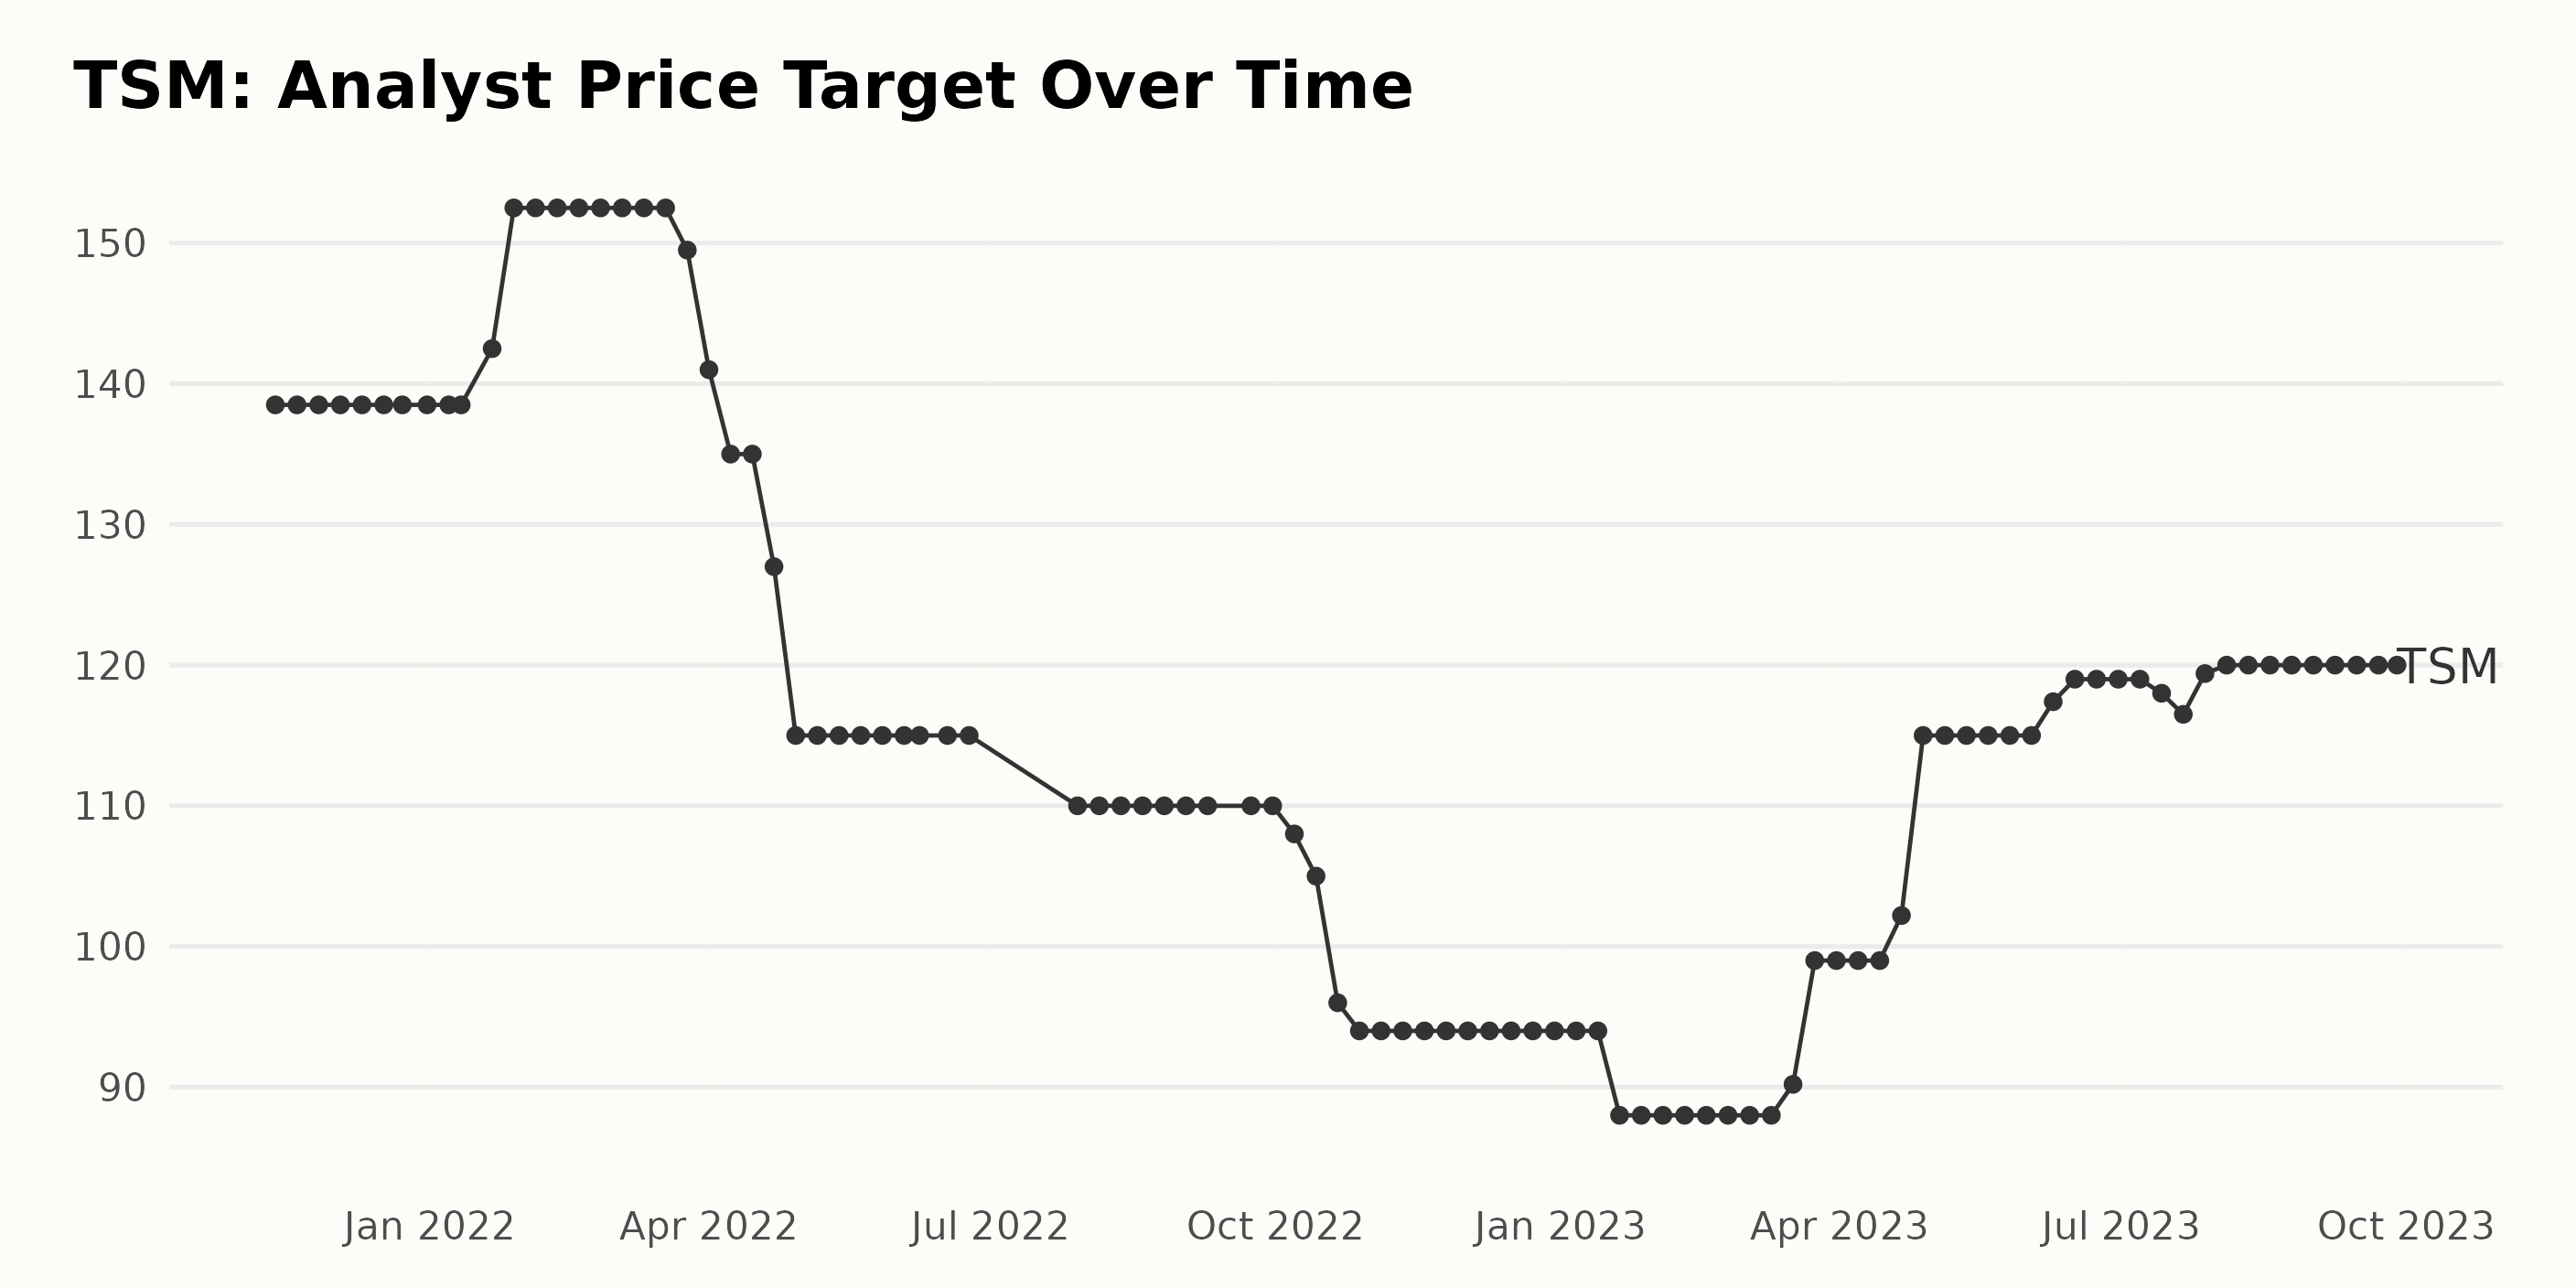
The analyst price target for TSM experienced a varied trend over the proposed time period. Below is a summarized exploration of the fluctuations:
- The initial analyst price target was stable at $138.5 from November 12, 2021, until January 11, 2022.
- From January 21, 2022, there was a significant increase, reaching a high of $152.5 on February 4, 2022.
- This sustained level continued until March 18, 2022, when we witnessed a steep downward trend culminating in a target of $94 on October 21, 2022.
- Stability was observed again, with the target price maintained at $94 until January 13, 2023.
- In the remaining period, we experienced several shifts. The most notable increase was from $88 on February 17, 2023, to $115 on April 28, 2023.
- Following this, the target price gradually increased, reaching a final value of $120 on August 4, 2023, which remained constant until the end of the series on September 28, 2023.
Overall, there was an approximate decrease of 16% in the analyst price target from the start of the series ($138.5) to the end ($120). While fluctuating, the majority of the values in this series range between $94 and $152.5. It's essential to consider these numbers, recognizing the weight of more recent data in representing current values.
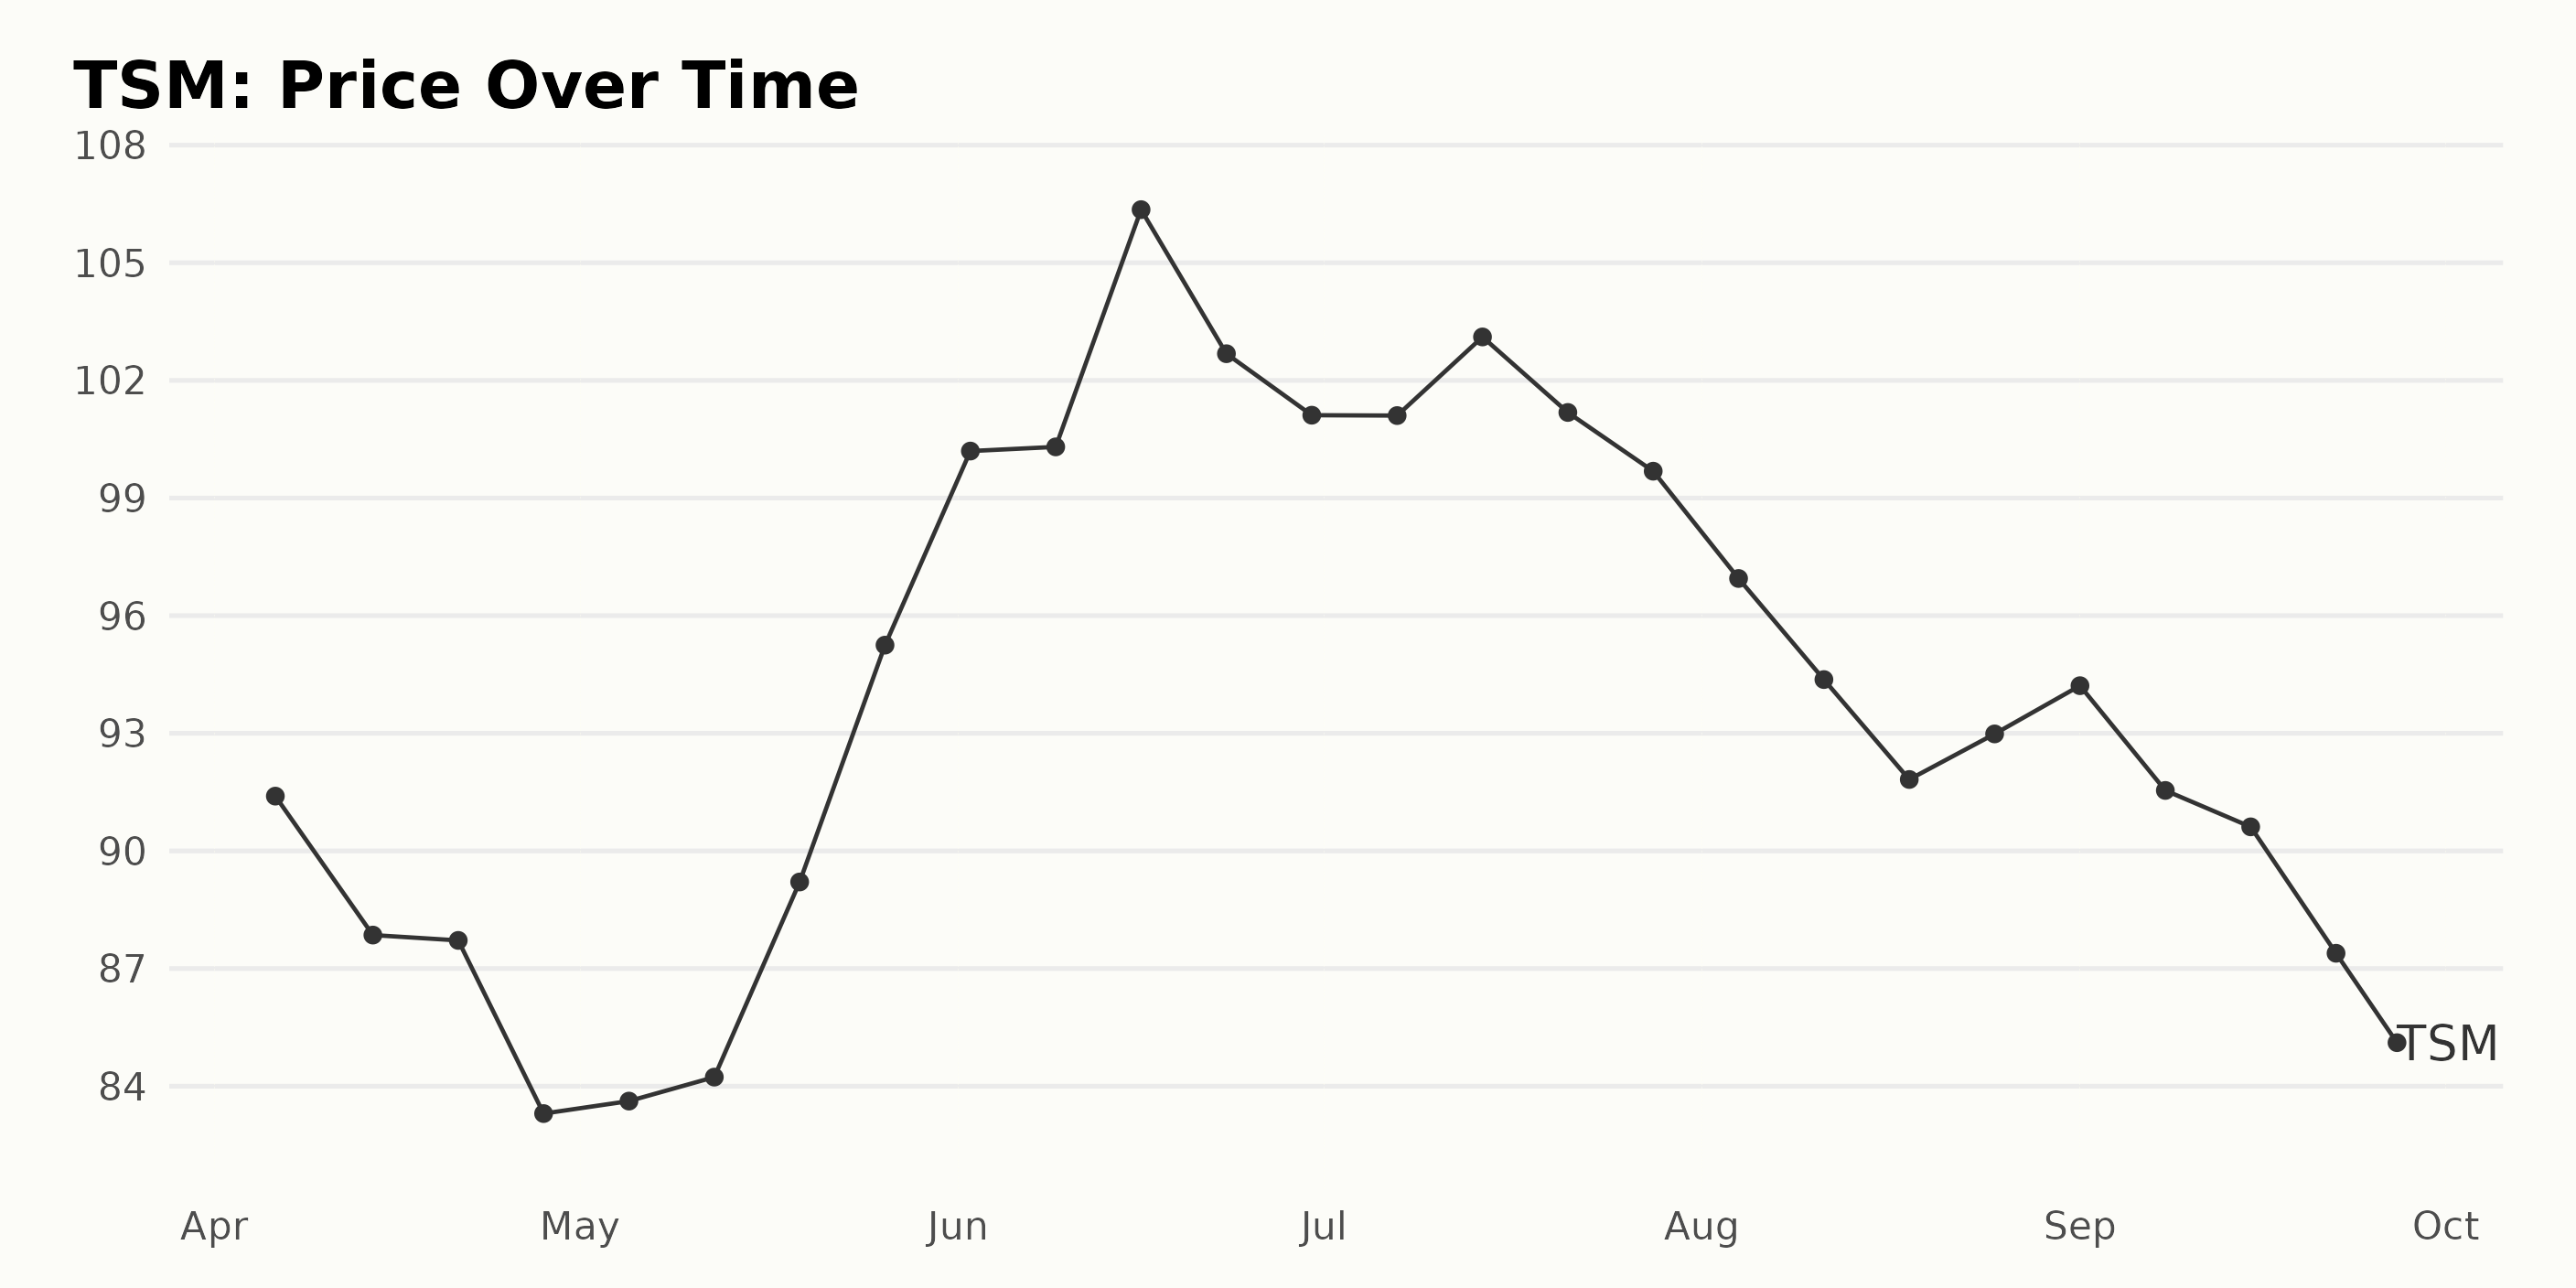
Analyzing TSM's Share Price Fluctuations From April to September 2023
Reviewing the provided data, we can observe the following trends in the share price of TSM:
- On April 6, 2023, the share prices were at an estimated $91.40.
- There was a decline in share prices, reaching as low as $83.30 on April 28, 2023.
- In May 2023, the company started regaining share value, rising from $83.62 at the start of the month to $95.25 by the end of the month.
- The company's shares noticeably increased in June, peaking at $106.35 on June 16, 2023.
- The price then underwent some fluctuation until July 28, 2023, with prices generally hovering around the $100 mark.
- August saw another downward trend, with the share price ending at $92.98 on August 25, 2023.
- In September, share prices fell further to $85.44 on September 27, 2023.
In conclusion, the general trend for the TSM share price over this time period is a gradual increase in value until mid-June 2023, followed by a consistent fall into late September 2023. This demonstrates a decelerating growth rate in the second half of the given period. Here is a chart of TSM's price over the past 180 days.
Analyzing TSM's Strong Performance Through Momentum, Quality, And Sentiment Ratings
The POWR Ratings grade of TSM has shown varying performance within the Semiconductor & Wireless Chip category, comprising 91 stocks overall. Below is a detailed overview:
- Starting from April 1, 2023, until July 22, 2023, TSM consistently held a POWR Grade of B (Buy), with its rank in the category fluctuating between #20 and #27 during this period.
- On July 29, 2023, there was a drop in the POWR Grade to C (Neutral), with its rank in the category falling to #32. This lower performance continued until August 9, 2023.
- The POWR Grade returned to B (Buy) on August 19, 2023, with a significant improvement in the rank-in-category to #20.
- There was a brief drop back to C (Neutral) on September 23. However, it quickly improved back to B (Buy) by September 27, 2023.
Based on the data, as of the most recent date given, September 28, 2023, TSM's POWR Grade is C (Neutral), with its rank-in-category being #22.
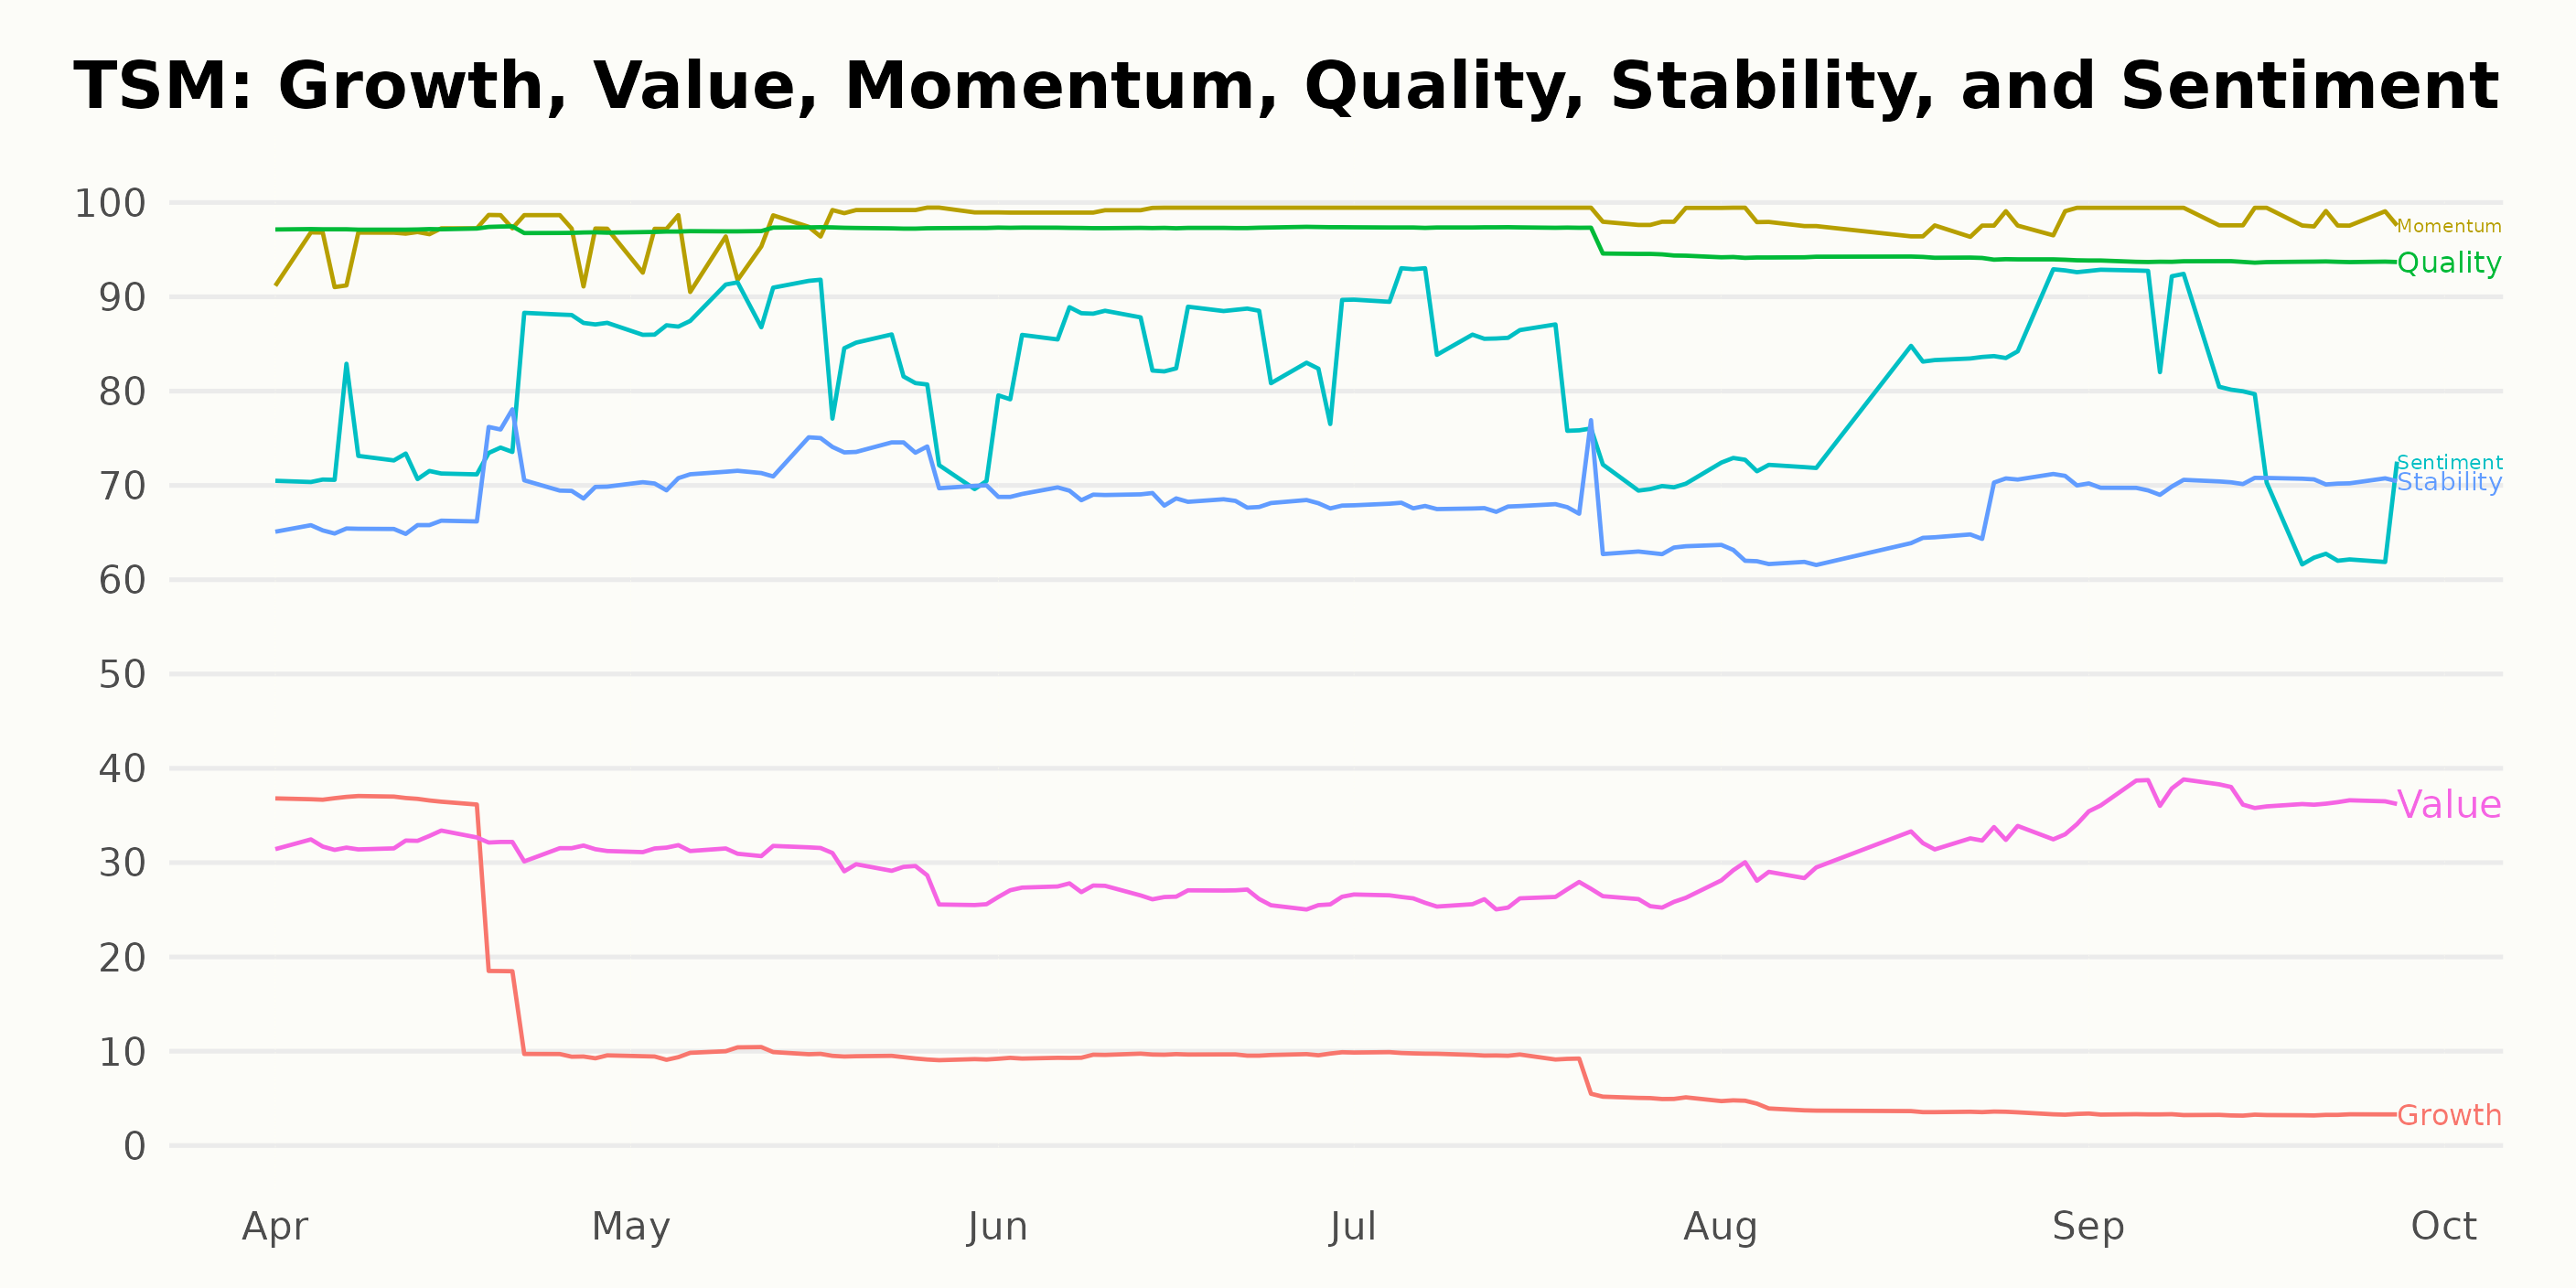
The POWR Ratings for TSM over time reveal that the three most noteworthy dimensions are Momentum, Quality, and Sentiment. Here is a detailed examination of these three dimensions:
Momentum: Throughout the observed period, the Momentum rating for TSM remains significantly high. Starting at 96 in April 2023, this dimension steadily rises to reach a peak of 99 in June 2023, maintains this level in July, and then again in September 2023, with a slight dip to 98 in August. Clearly, Momentum is one aspect where TSM is performing exceptionally well.
Quality: Quality is the second dimension where TSM has sustained high ratings. It constantly stays at 97 from April to July 2023. The rating slightly decreases to 94 in August, remaining at this value till September 2023. This dimension suggests that the underlying earnings power of TSM is strong and stable.
Sentiment: While the Sentiment rating is not as high as Momentum and Quality, it still shows an interesting trend. Starting at 77 in April 2023, the rating jumps to 84 in May, eventually reaching 85 in June before descending and leveling off to 78 in September. Despite some fluctuations, the Sentiment rating maintains a robust standpoint reflecting positive market perceptions about TSM.
How does Taiwan Semiconductor Manufacturing Company Limited (TSM) Stack Up Against its Peers?
Other stocks in the Semiconductor & Wireless Chip sector that may be worth considering are Renesas Electronics Corporation (RNECF), Everspin Technologies, Inc. (MRAM), and STMicroelectronics N.V. (STM) - they have better POWR Ratings. Click here to explore more Semiconductor & Wireless Chip stocks.
What To Do Next?
Get your hands on this special report with 3 low priced companies with tremendous upside potential even in today’s volatile markets:
3 Stocks to DOUBLE This Year >
TSM shares were trading at $86.60 per share on Thursday afternoon, up $1.16 (+1.36%). Year-to-date, TSM has gained 17.60%, versus a 13.30% rise in the benchmark S&P 500 index during the same period.
About the Author: Anushka Dutta

Anushka is an analyst whose interest in understanding the impact of broader economic changes on financial markets motivated her to pursue a career in investment research.
The post Taiwan Semiconductor Manufacturing (TSM) - October Buy, Sell or Hold? appeared first on StockNews.com