


The U.S. stock market ended last week on a positive note, as the job report showed that employment in September rose by the most in eight months, raising the possibility of a “soft landing” scenario the Federal Reserve is aiming for. The tech-heavy NASDAQ Composite gained 1.6% intraday, ending the week in the green.
The tech industry’s powerhouse Apple Inc. (AAPL) also gained in share prices last week, buoyed by the tech sector’s robust performance. The company’s higher-than-industry profitability is also laudable. Its trailing-12-month net income margin of 24.68% compares to the industry average of 2.11%.
However, the company is facing regulatory actions in South Korea. The country’s telecommunication regulator, the Korea Communications Commission (KCC), revealed hefty fines on two tech giants, including AAPL, for violating in-app payments law.
Given this backdrop, let’s look at the trends of AAPL’s key financial metrics to understand why it could be wise to wait for a better entry point in the stock.
Analyzing Apple Inc.'s Financial Performance and Growth Trends (2020-2023)
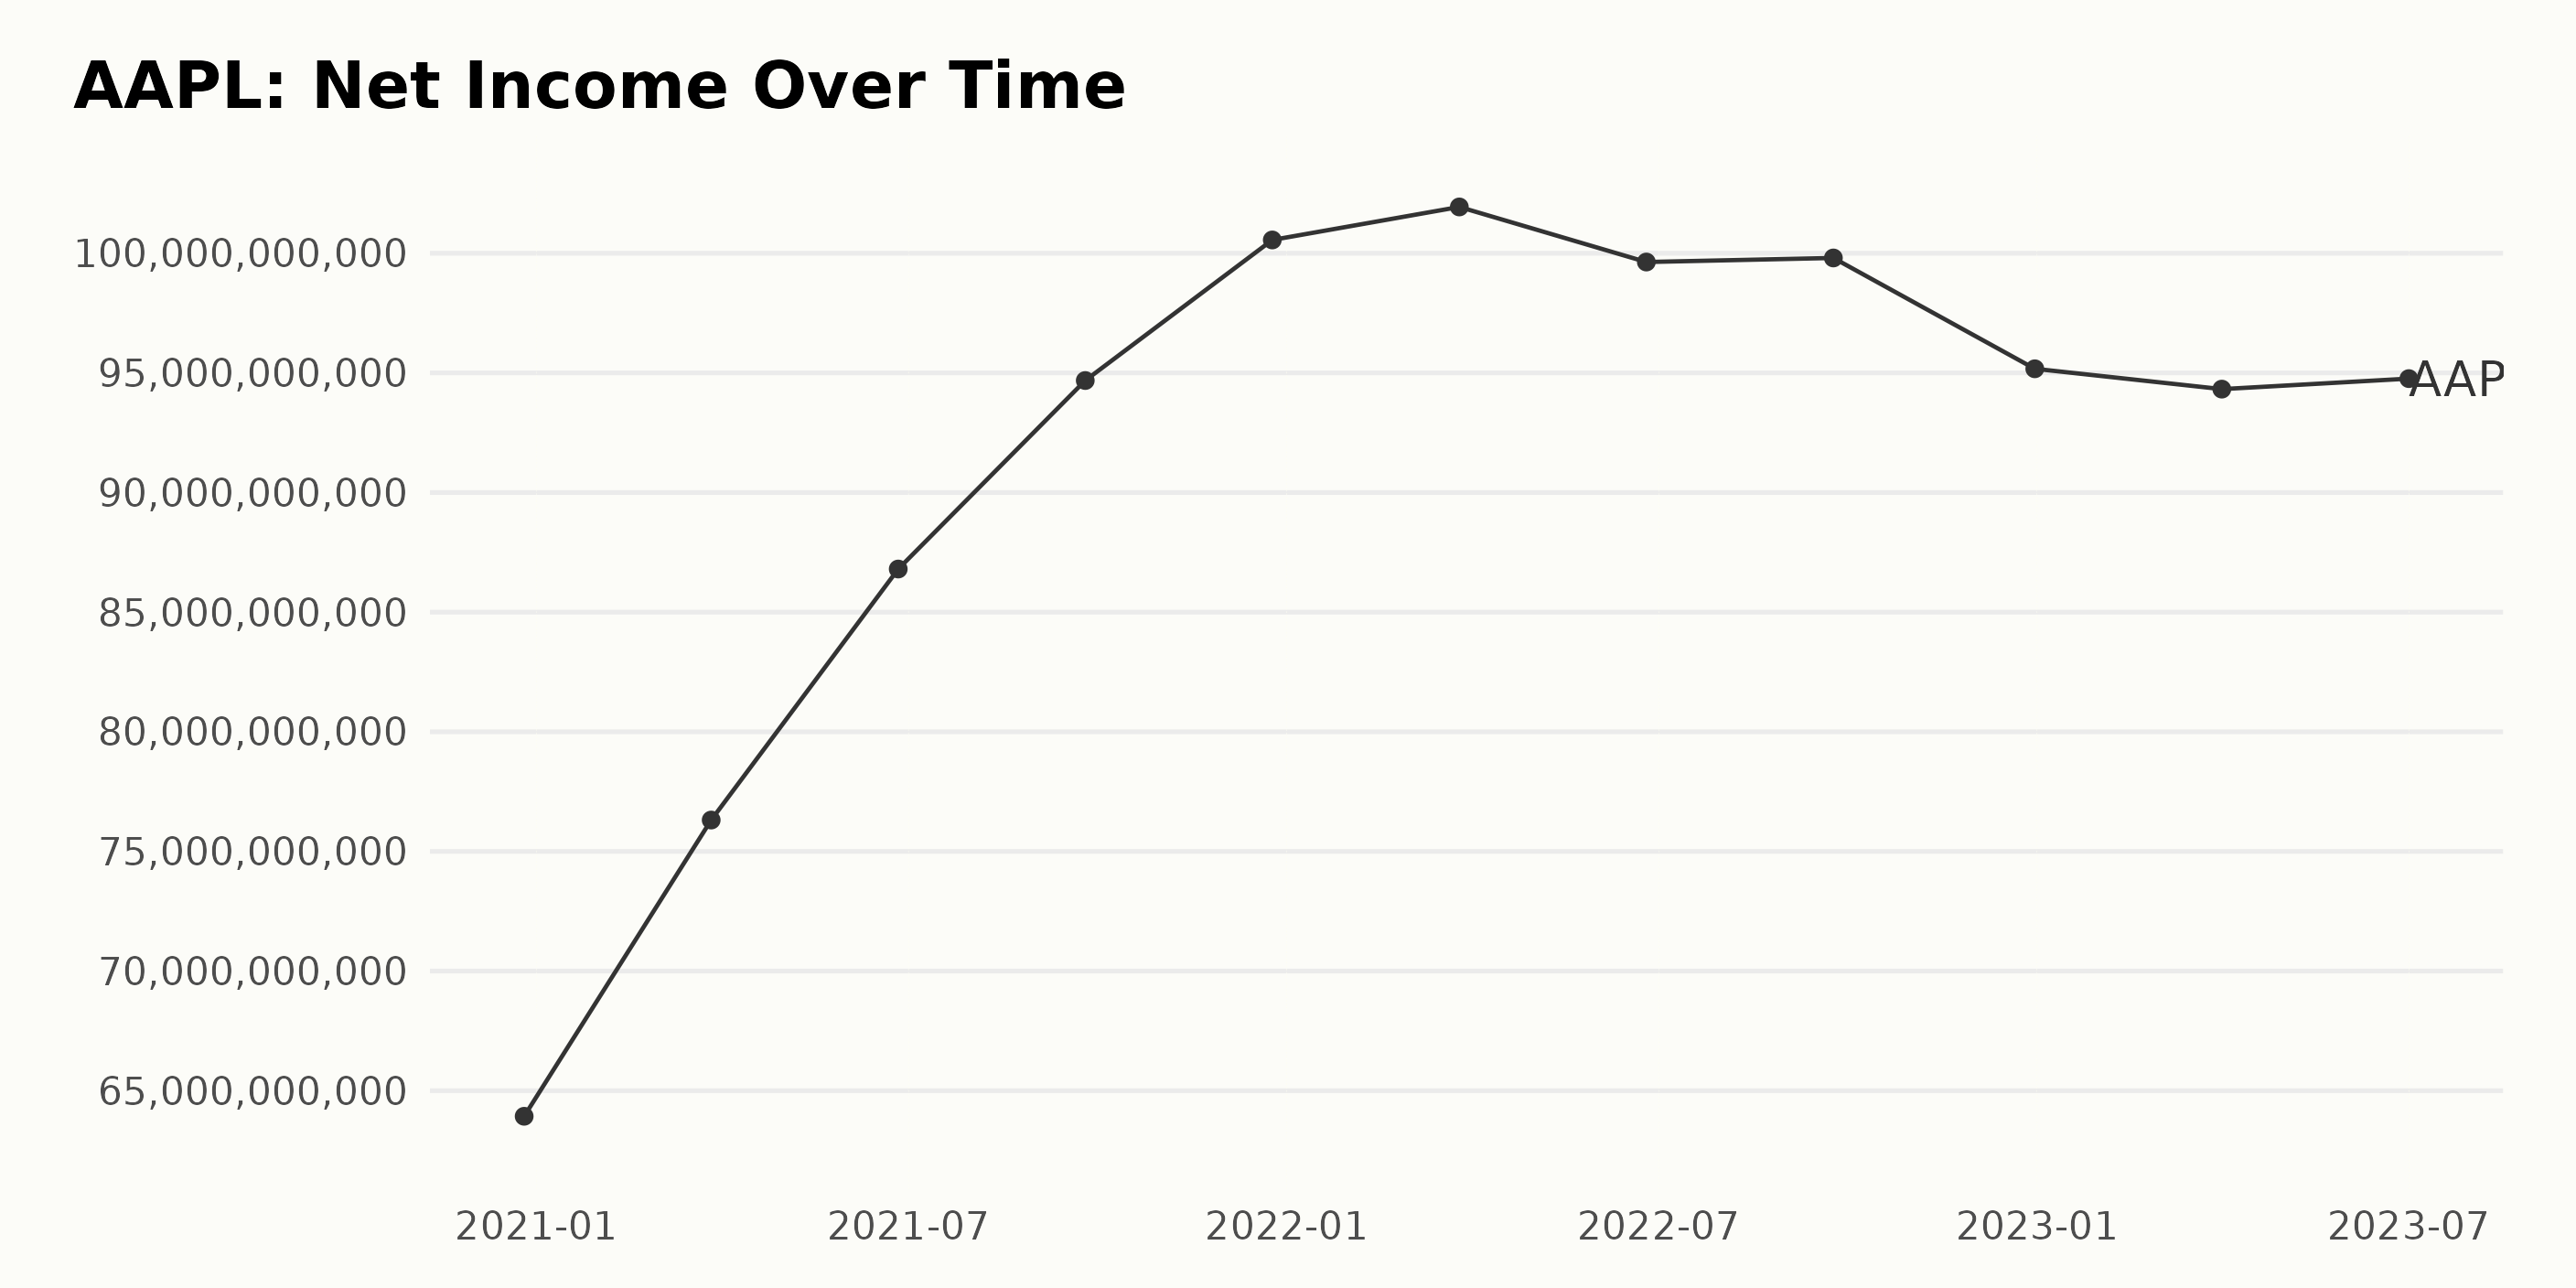
The trailing-12-month net income of AAPL over the years is characterized by a general growth trend, with intermittent fluctuations observed. To provide an in-depth analysis, the following data points outline the net income trend:
- Started at $63.93 billion on December 26, 2020.
- Increased to $76.31 billion by March 27, 2021, marking significant growth.
- Continued the upward trajectory, reaching $86.80 billion by June 26, 2021.
- Further grew to $94.68 billion as of September 25, 2021.
- Peaked to $100.56 billion by December 25, 2021, a historic high in the series.
- $101.94 billion was the reported figure on March 26, 2022, sustaining the growth.
- Slight dips were noticed with values of $99.63 billion and $99.80 billion on June 25, 2022, and September 24, 2022, respectively.
- Dropped to $95.17 billion by the end of 2022.
- Decreased further to hit $94.32 billion on April 1, 2023.
- The series ended with a slight increase to $94.76 billion on July 1, 2023.
The overall trend showcases a rise in the net income of AAPL from $63.93 billion at the start of the review period to $94.76 billion in the recent figures, suggesting a growth rate of approximately 48%. Yet, it's important to note some fluctuations and a decreased growth rate towards the end of the series, particularly after peaking in late 2021.
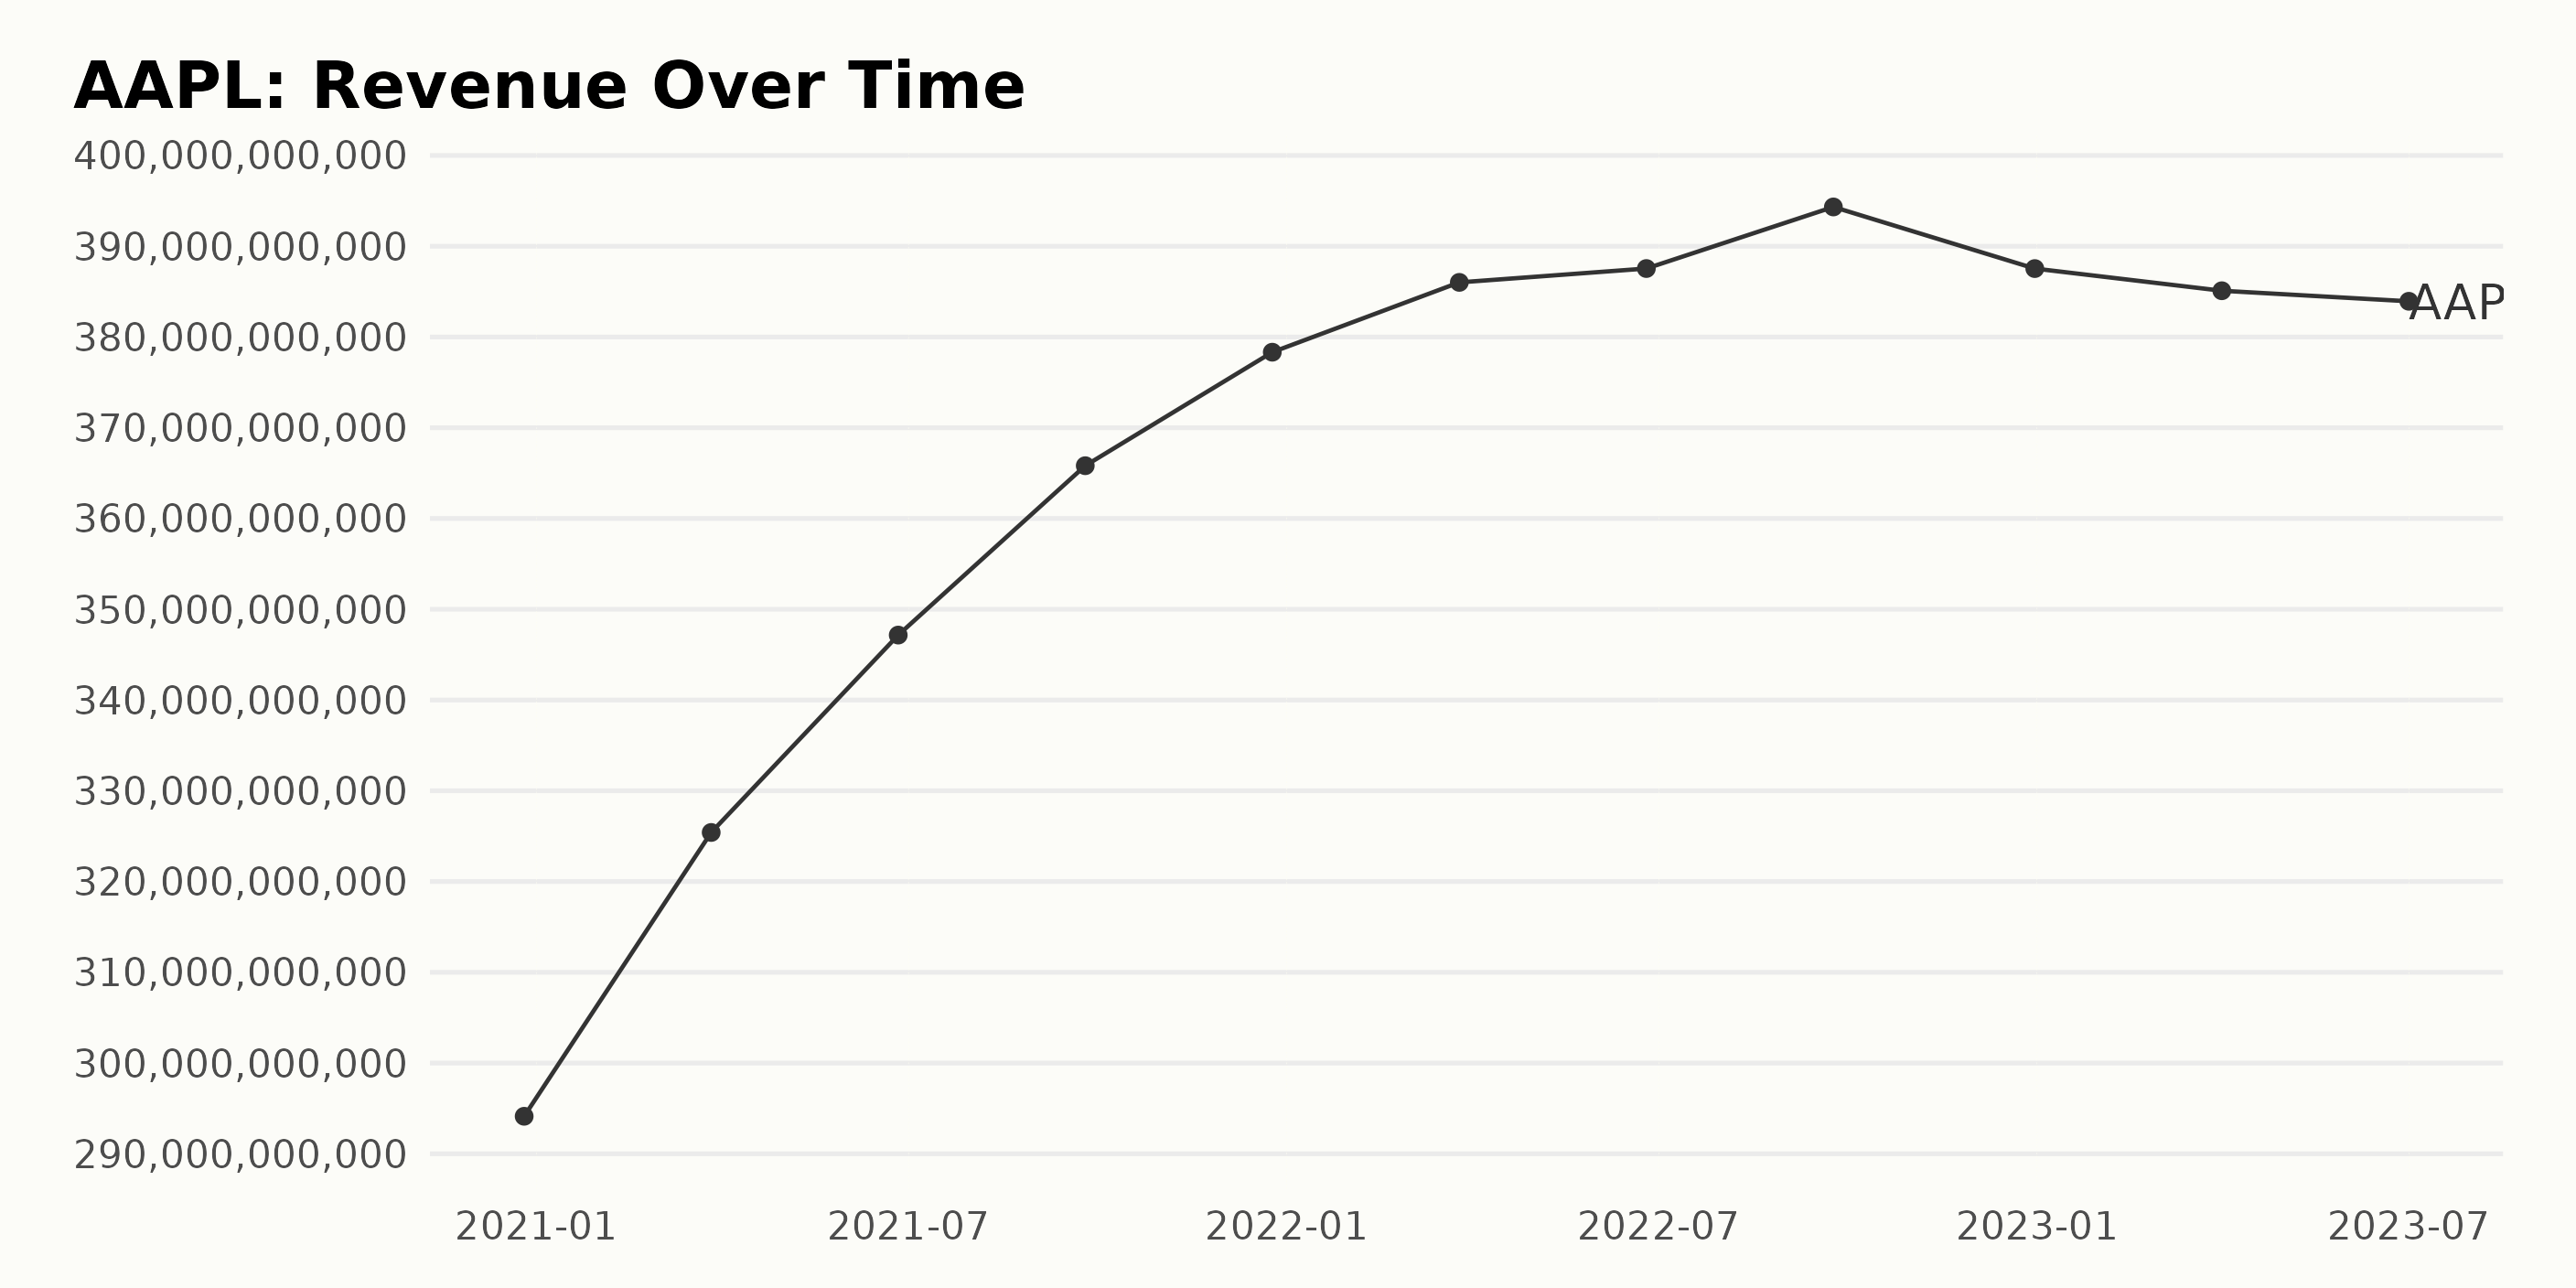
AAPL’s trailing-12-month revenue experienced a consistent growth trend from December 2020 to September 2022 before witnessing a slight decline. Here's a summary of the data points:
- As of December 26, 2020, Apple reported a revenue of $294.14 billion.
- Through the course of 2021, the revenue steadily increased, reaching $378.32 billion by December 25, 2021.
- The upward momentum continued the following year until September 24, 2022, when the revenue peaked at $394.33 billion.
- However, there was a marginal drop in revenue during the last quarter of 2022 to $387.54 billion as of December 31, 2022.
- As we moved further into 2023, the revenue continued this downward trajectory, dropping slightly to $385.10 billion in April and again to $383.93 billion as of July 1, 2023.
When comparing the final data point (July 2023 - $383.93 billion) with the first (December 2020 - $294.14 billion), it highlights a substantial growth of approximately 30.53% over 2.5 years, indicating an overall positive trend despite recent fluctuations.
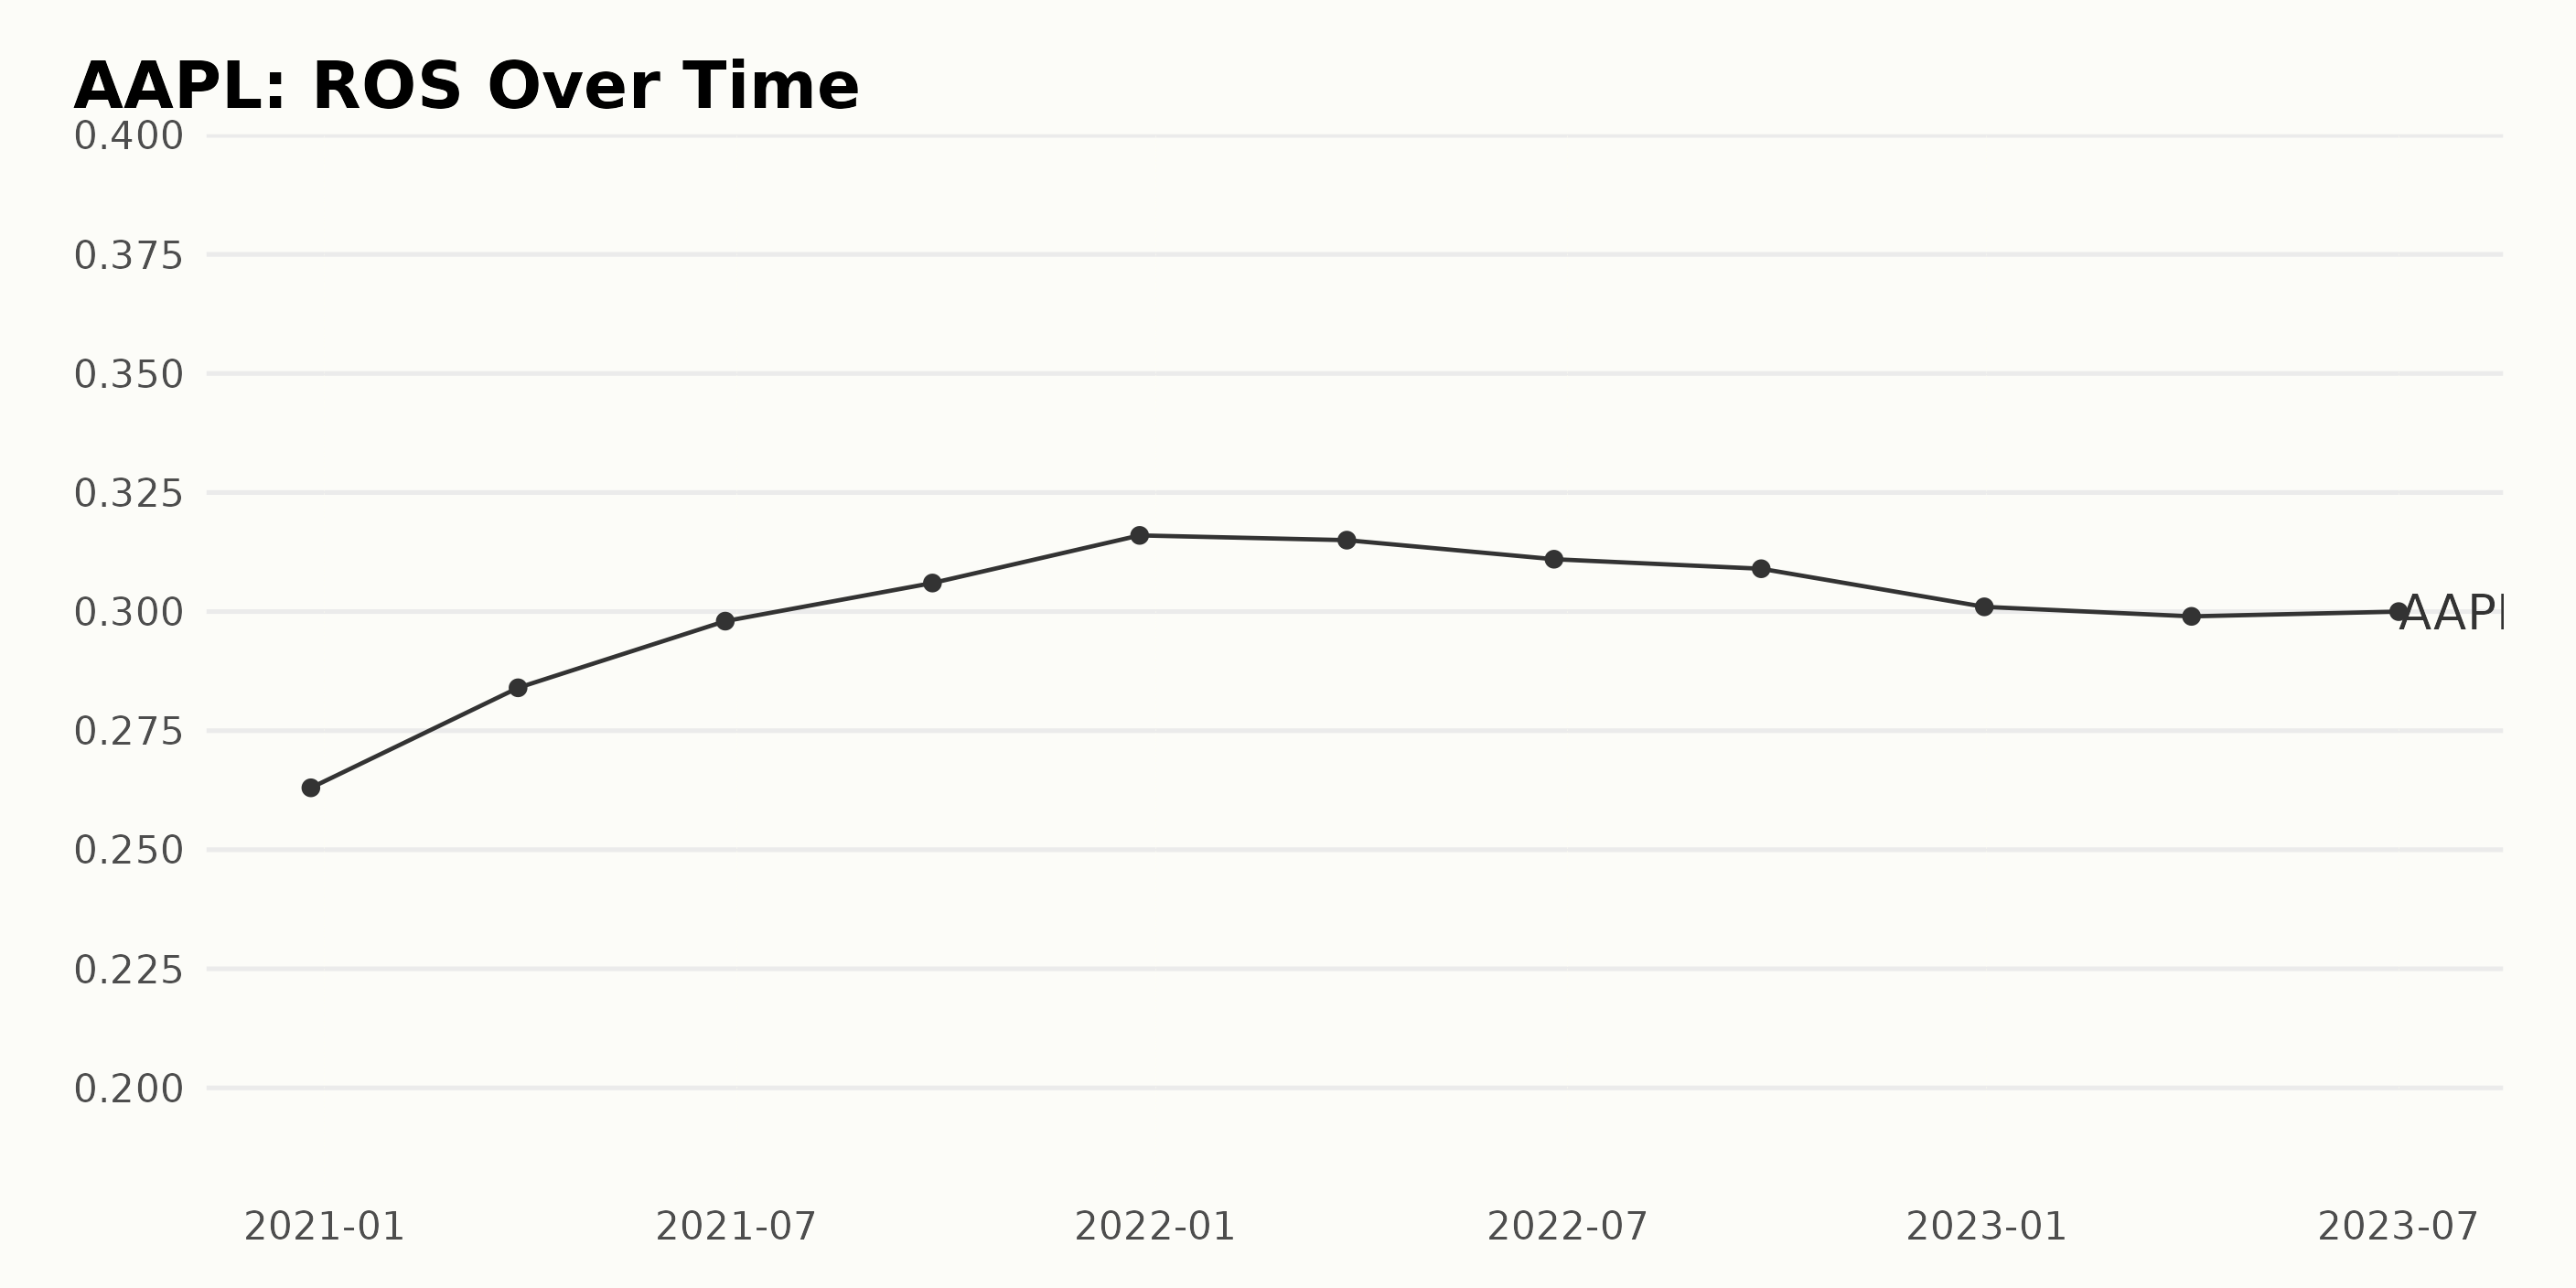
Summary of AAPL Return On Sales (ROS):
- On December 26, 2020, the ROS for AAPL was 0.26.
- There was a steady increase in the ROS over the next four quarters, peaking at 0.31 on September 25, 2021.
- However, by December 25, 2021, it had slipped slightly to 0.316. Nevertheless, this marked a significant increase from the series' outset, reflecting a 20% growth rate.
- The ROS saw little fluctuation throughout 2022, with values marginally declining yet remaining slightly above 0.31. By the end of the year, however, it had dipped below this level to 0.301 on December 31.
- Into 2023, the company's ROS started to stabilize around the 0.3 mark, as seen from data points on April 1 and July 1.
Key Takeaway: Between December 2020 and July 2023, AAPL's ROS demonstrated overall growth despite slight fluctuations, particularly in 2022. The last recorded ROS shows slight stability around 0.3, indicating a possible new plateau for this metric.
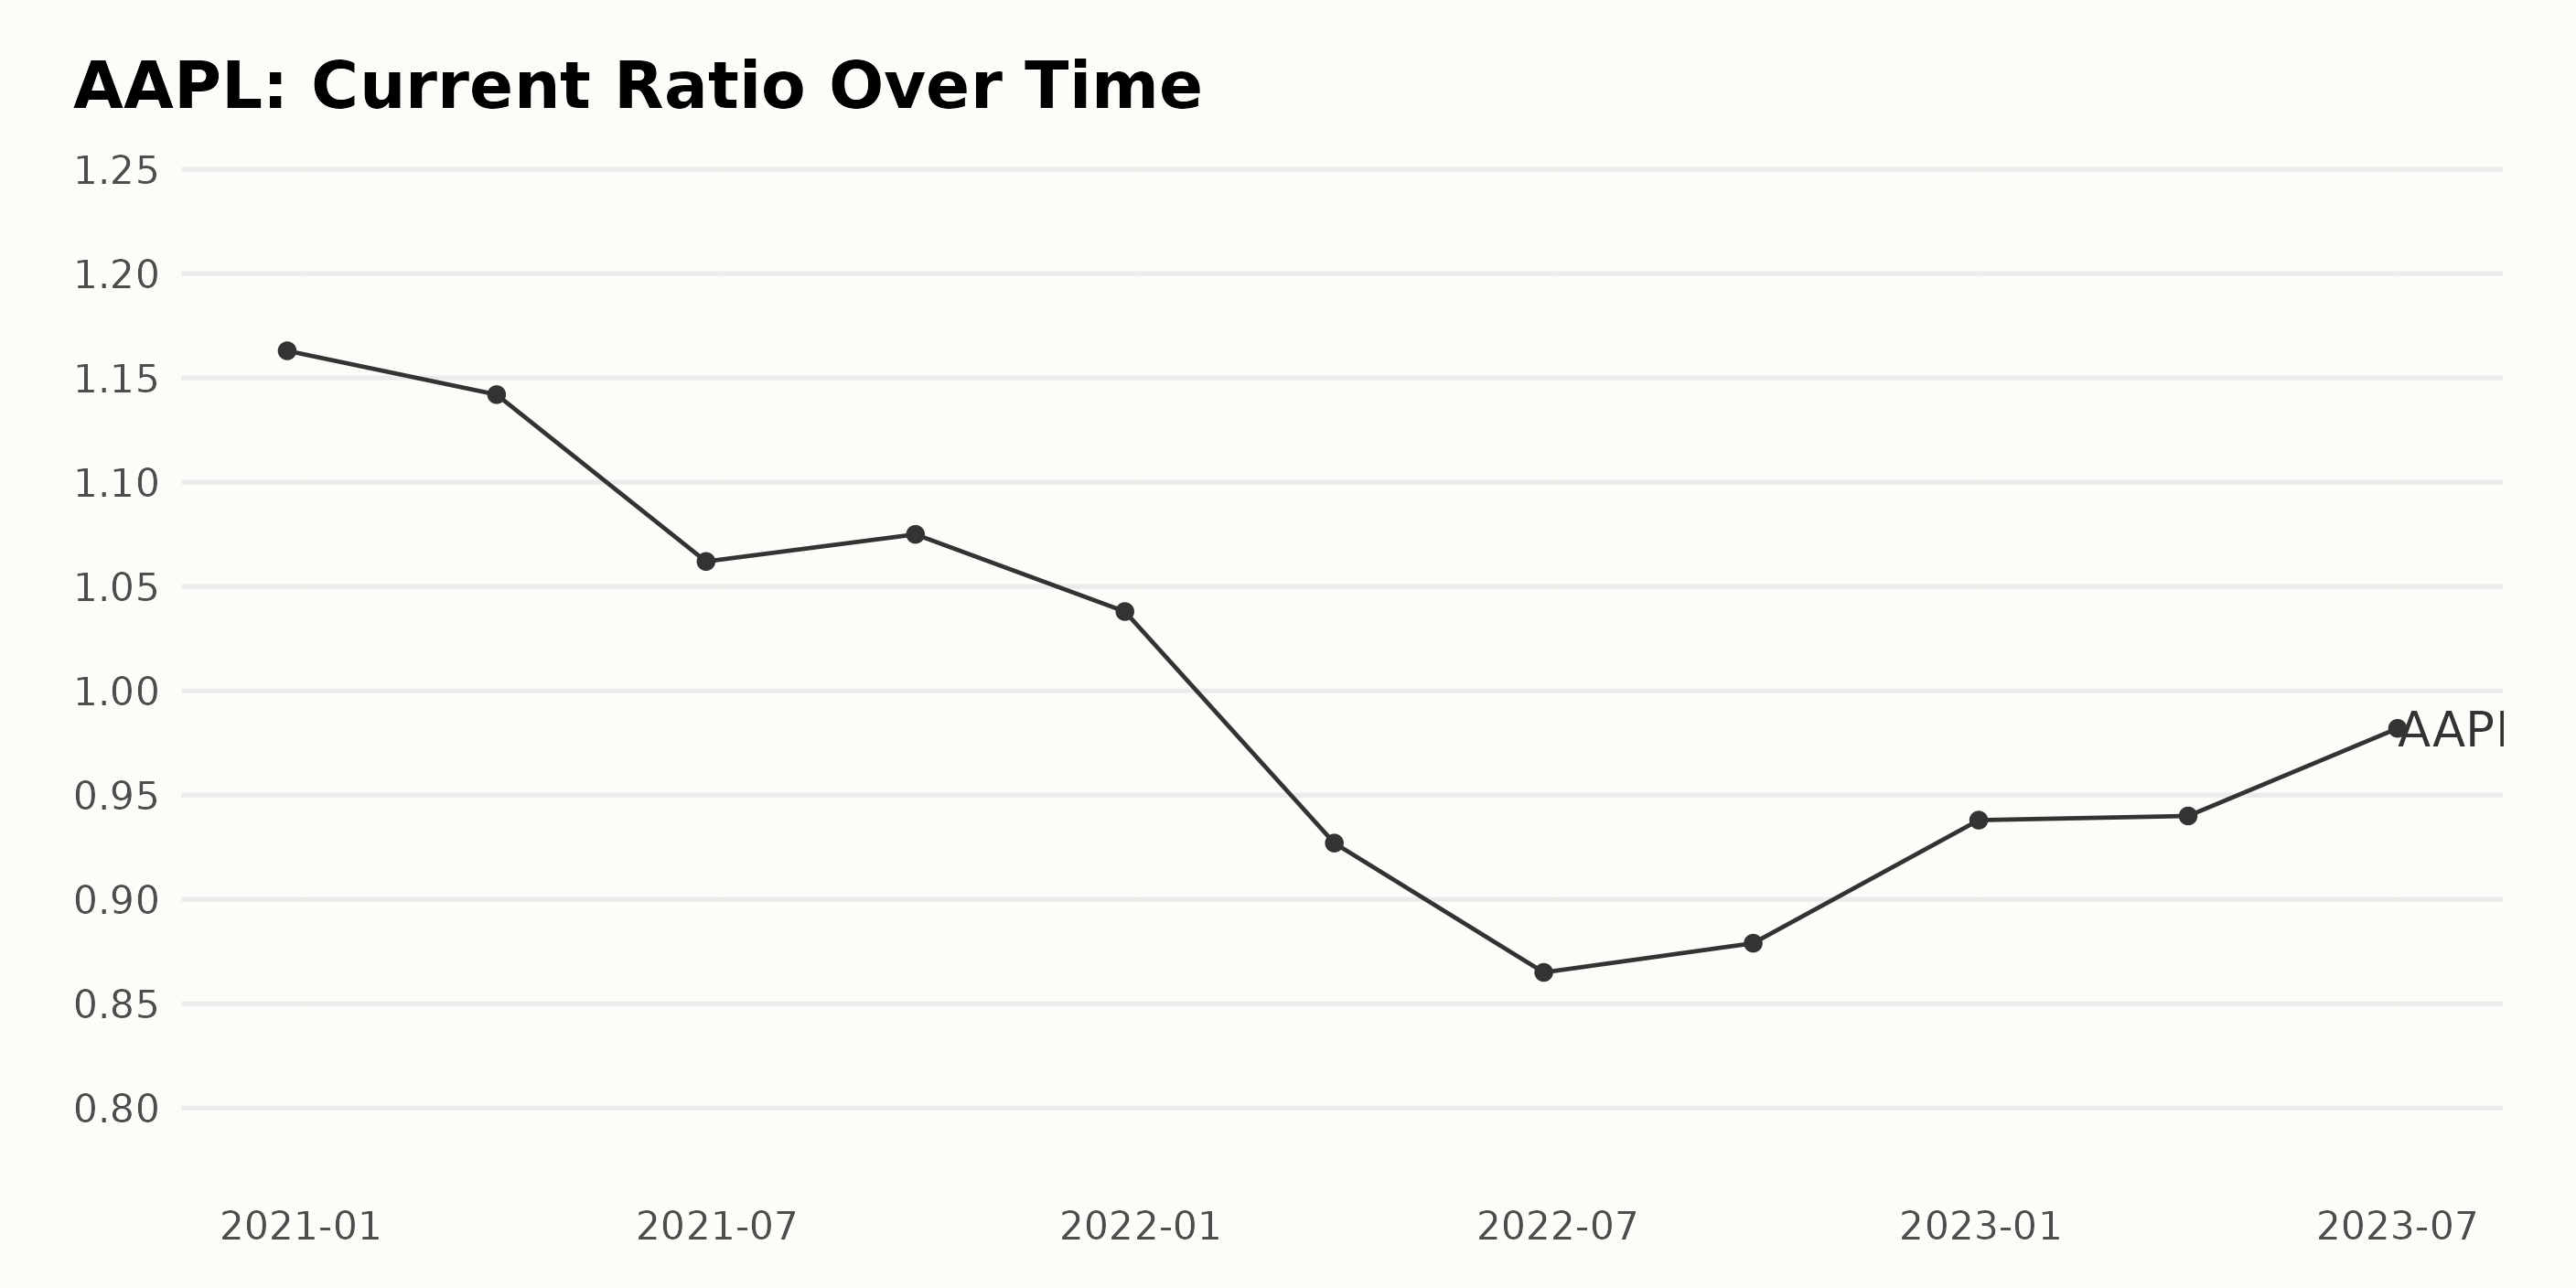
The current ratio of AAPL has generally shown a downward trend in the period under review, with slight fluctuations around this trend observed.
- In December 2020, the current ratio stood at 1.16 and saw a series of downward fluctuations over the subsequent periods, ultimately dropping to 0.94 as of July 2023.
- Notable short-term fluctuations are seen between June and September 2022, where the current ratio dipped to 0.87 before rising slightly to 0.88 in the following quarter.
- The most recent data from April to July 2023, though close, shows an upward movement from 0.94 to 0.98.
From December 2020 to July 2023, AAPL experienced an overall decrease in its current ratio by about 15%. This highlights a trend toward lower levels of liquidity over time despite some temporary rebounds within shorter periods. The most recent value in the data series points out a current ratio of 0.98 as of July 2023.
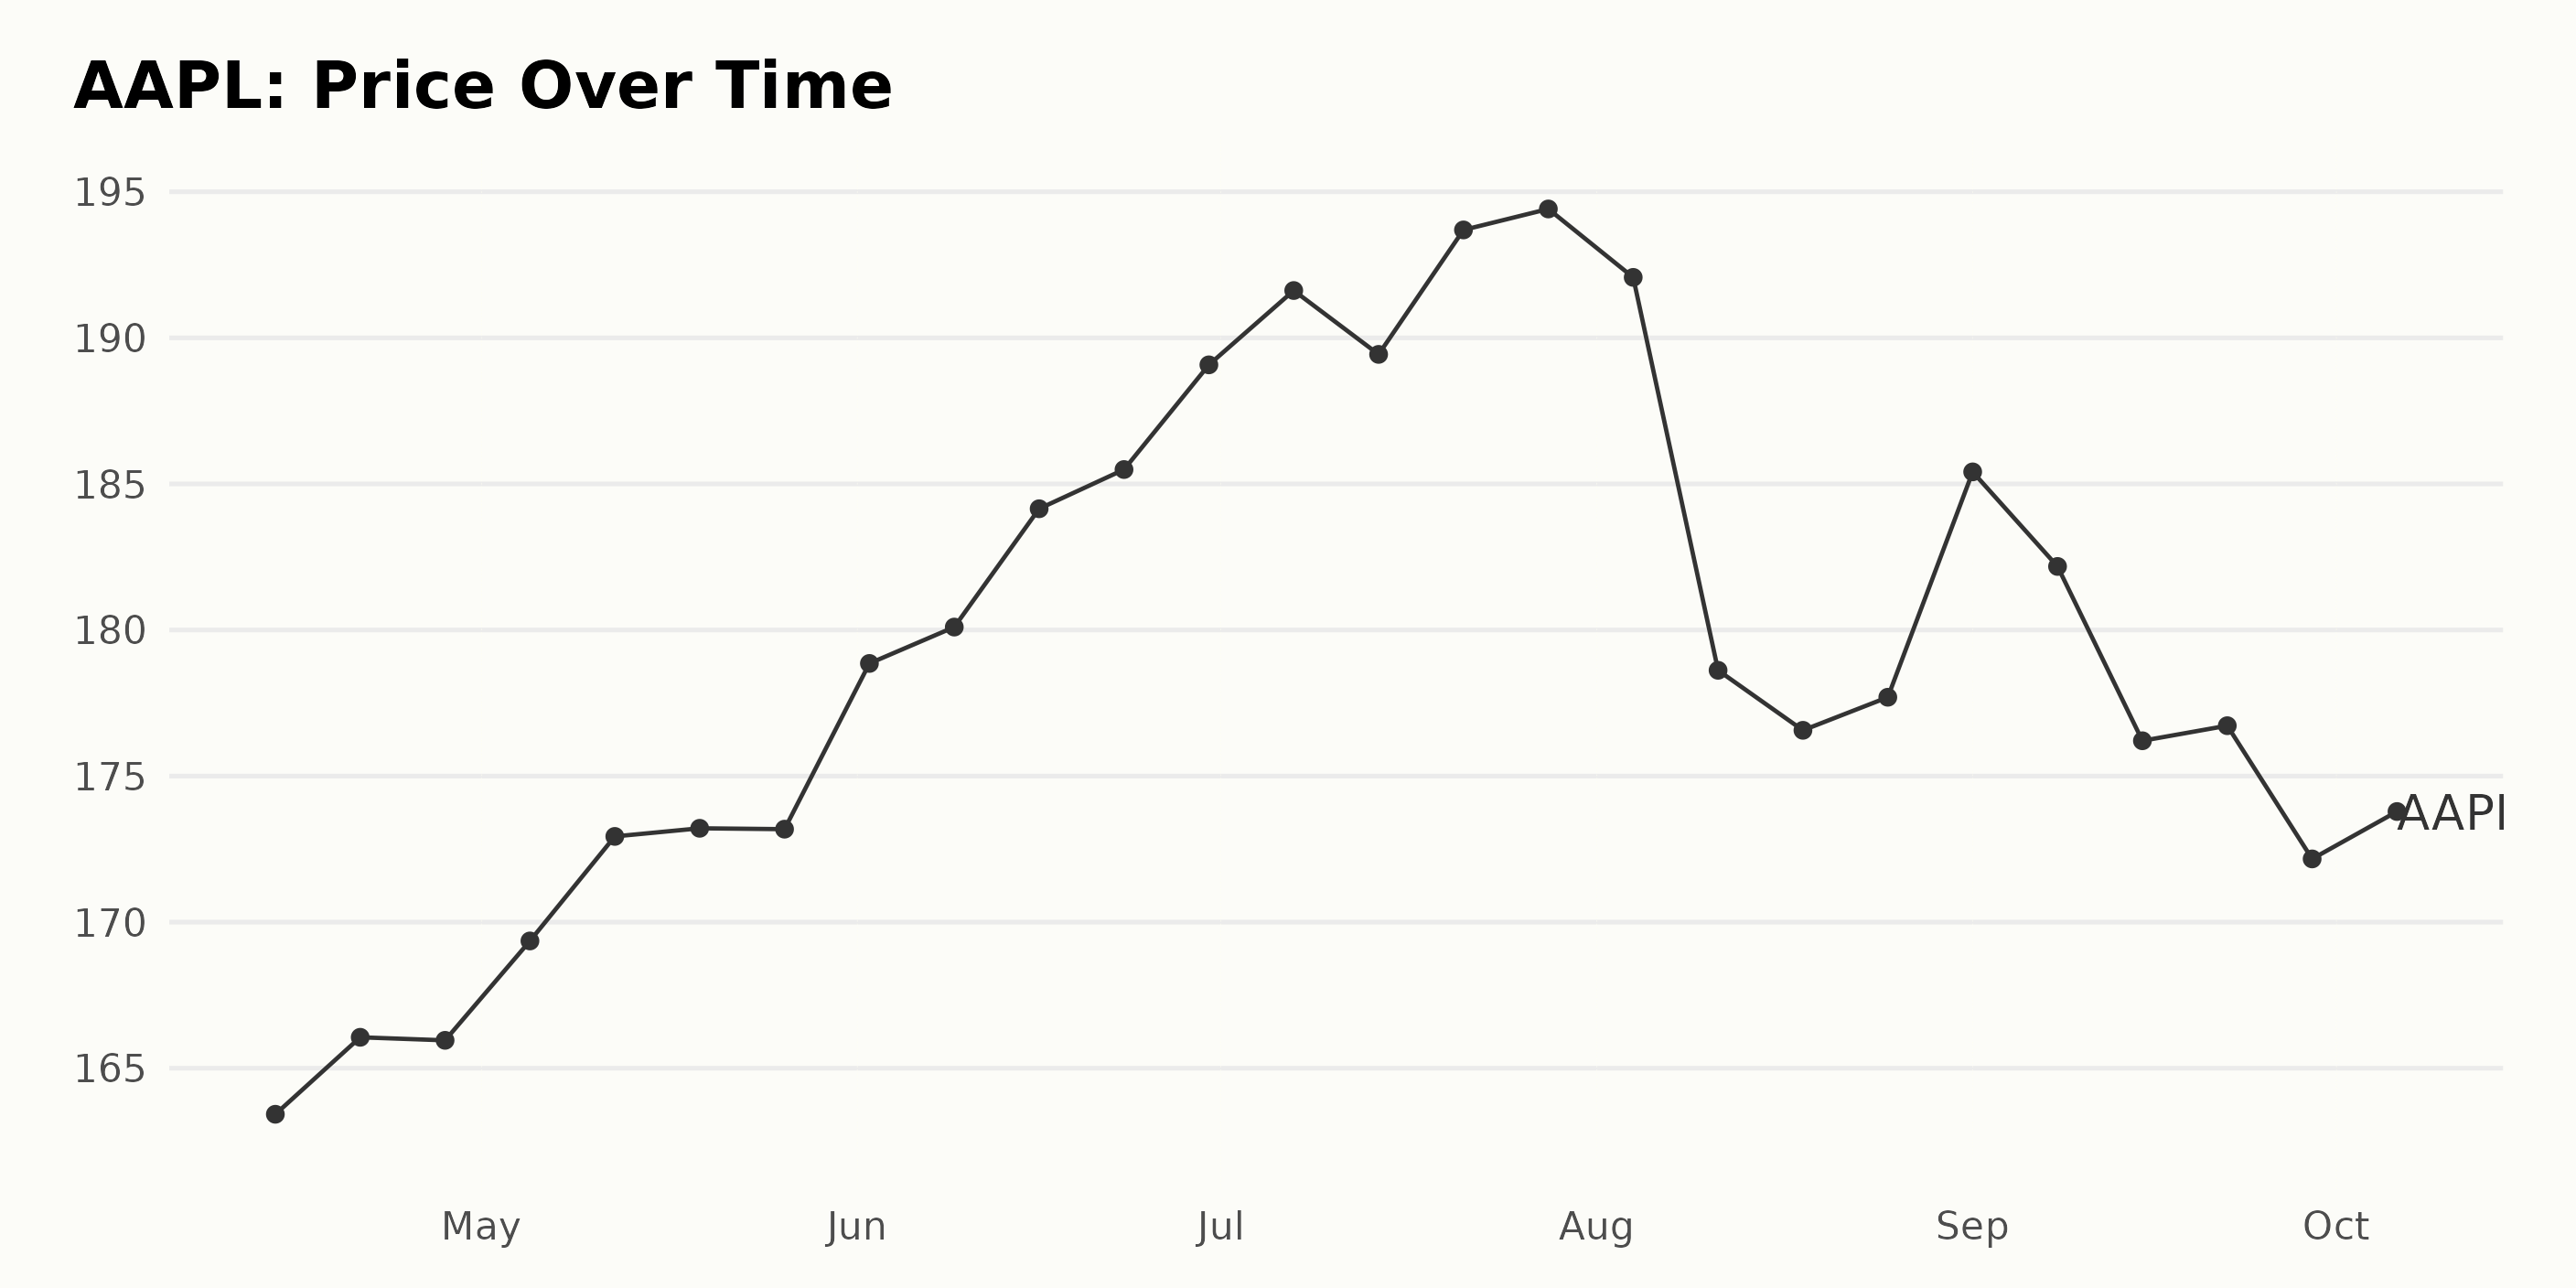
Examining Apple Inc.'s Share Price Fluctuations from April to October 2023
The data represents the trend and growth rate of AAPL from April to October 2023:
- On April 14, 2023, the share price was $163.42.
- By April 21, 2023, it slightly increased to $166.06. However, it experienced a gentle dip to $165.95 by April 28, 2023.
- There is a consistent increasing trend in May, with the price rising from $169.36 on May 5, 2023, to $173.21 on May 19, 2023, which slightly declined to $173.18 by May 26, 2023.
- Throughout June, the acceleration continued with a sharp increase from $178.85 on June 2, 2023, to $189.08 by June 30, 2023.
- In July, the price trend fluctuated, peaking at $193.69 on July 21, 2023, before a slight dip to $192.07 by August 4, 2023.
- August witnessed a noticeable fall in AAPL's share price. It plummeted from $178.62 on August 11, 2023, to a low of $176.57 on August 18, 2023, before a minor recovery to $177.70 on August 25, 2023.
- In September, the price briefly recovered to $185.41 on September 1, 2023, but then fell again over the rest of the month, closing at $172.16 on September 29, 2023.
- By October 6, 2023, the share price rebounded slightly to $177.49.
In conclusion, the overall trend for AAPL across these months shows a general increase, with some periods of decline. The growth rate from April to June is increasing, while there is a significant deceleration in August. September saw a further fall, but there were signs of a minor recovery by early October. Here is a chart of AAPL's price over the past 180 days.
Apple Inc.'s POWR Ratings Breakdown: Quality, Momentum, and Sentiment Analysis
AAPL is a stock in the Technology - Hardware category, comprising a total of 41 stocks. The company's POWR Ratings grade and rank within this category have been analyzed for an extended period from April to October 2023. Here are the key observations:
The POWR Grade for AAPL has been consistently C (Neutral) through this period. This grade suggests that AAPL has been average in terms of performance when evaluated based on the distinct factors used by the POWR Ratings system.
From week to week, AAPL's rank in its category fluctuated moderately but has generally remained in the upper half, given that there are 41 stocks in total in its category. AAPL's varying position indicates that relative strength compared to other stocks has not been constant. Here are the details for the final month:
- Week of September 30, 2023: POWR Grade C, Category Rank: #22.
- As of October 9, 2023: POWR Grade C, Category Rank: #21.
This data signifies that while AAPL has maintained a steady POWR grade across these months, its corresponding category rank has seen mild inconsistencies. This could suggest periodic changes in either AAPL's performance or that of its competing stocks.
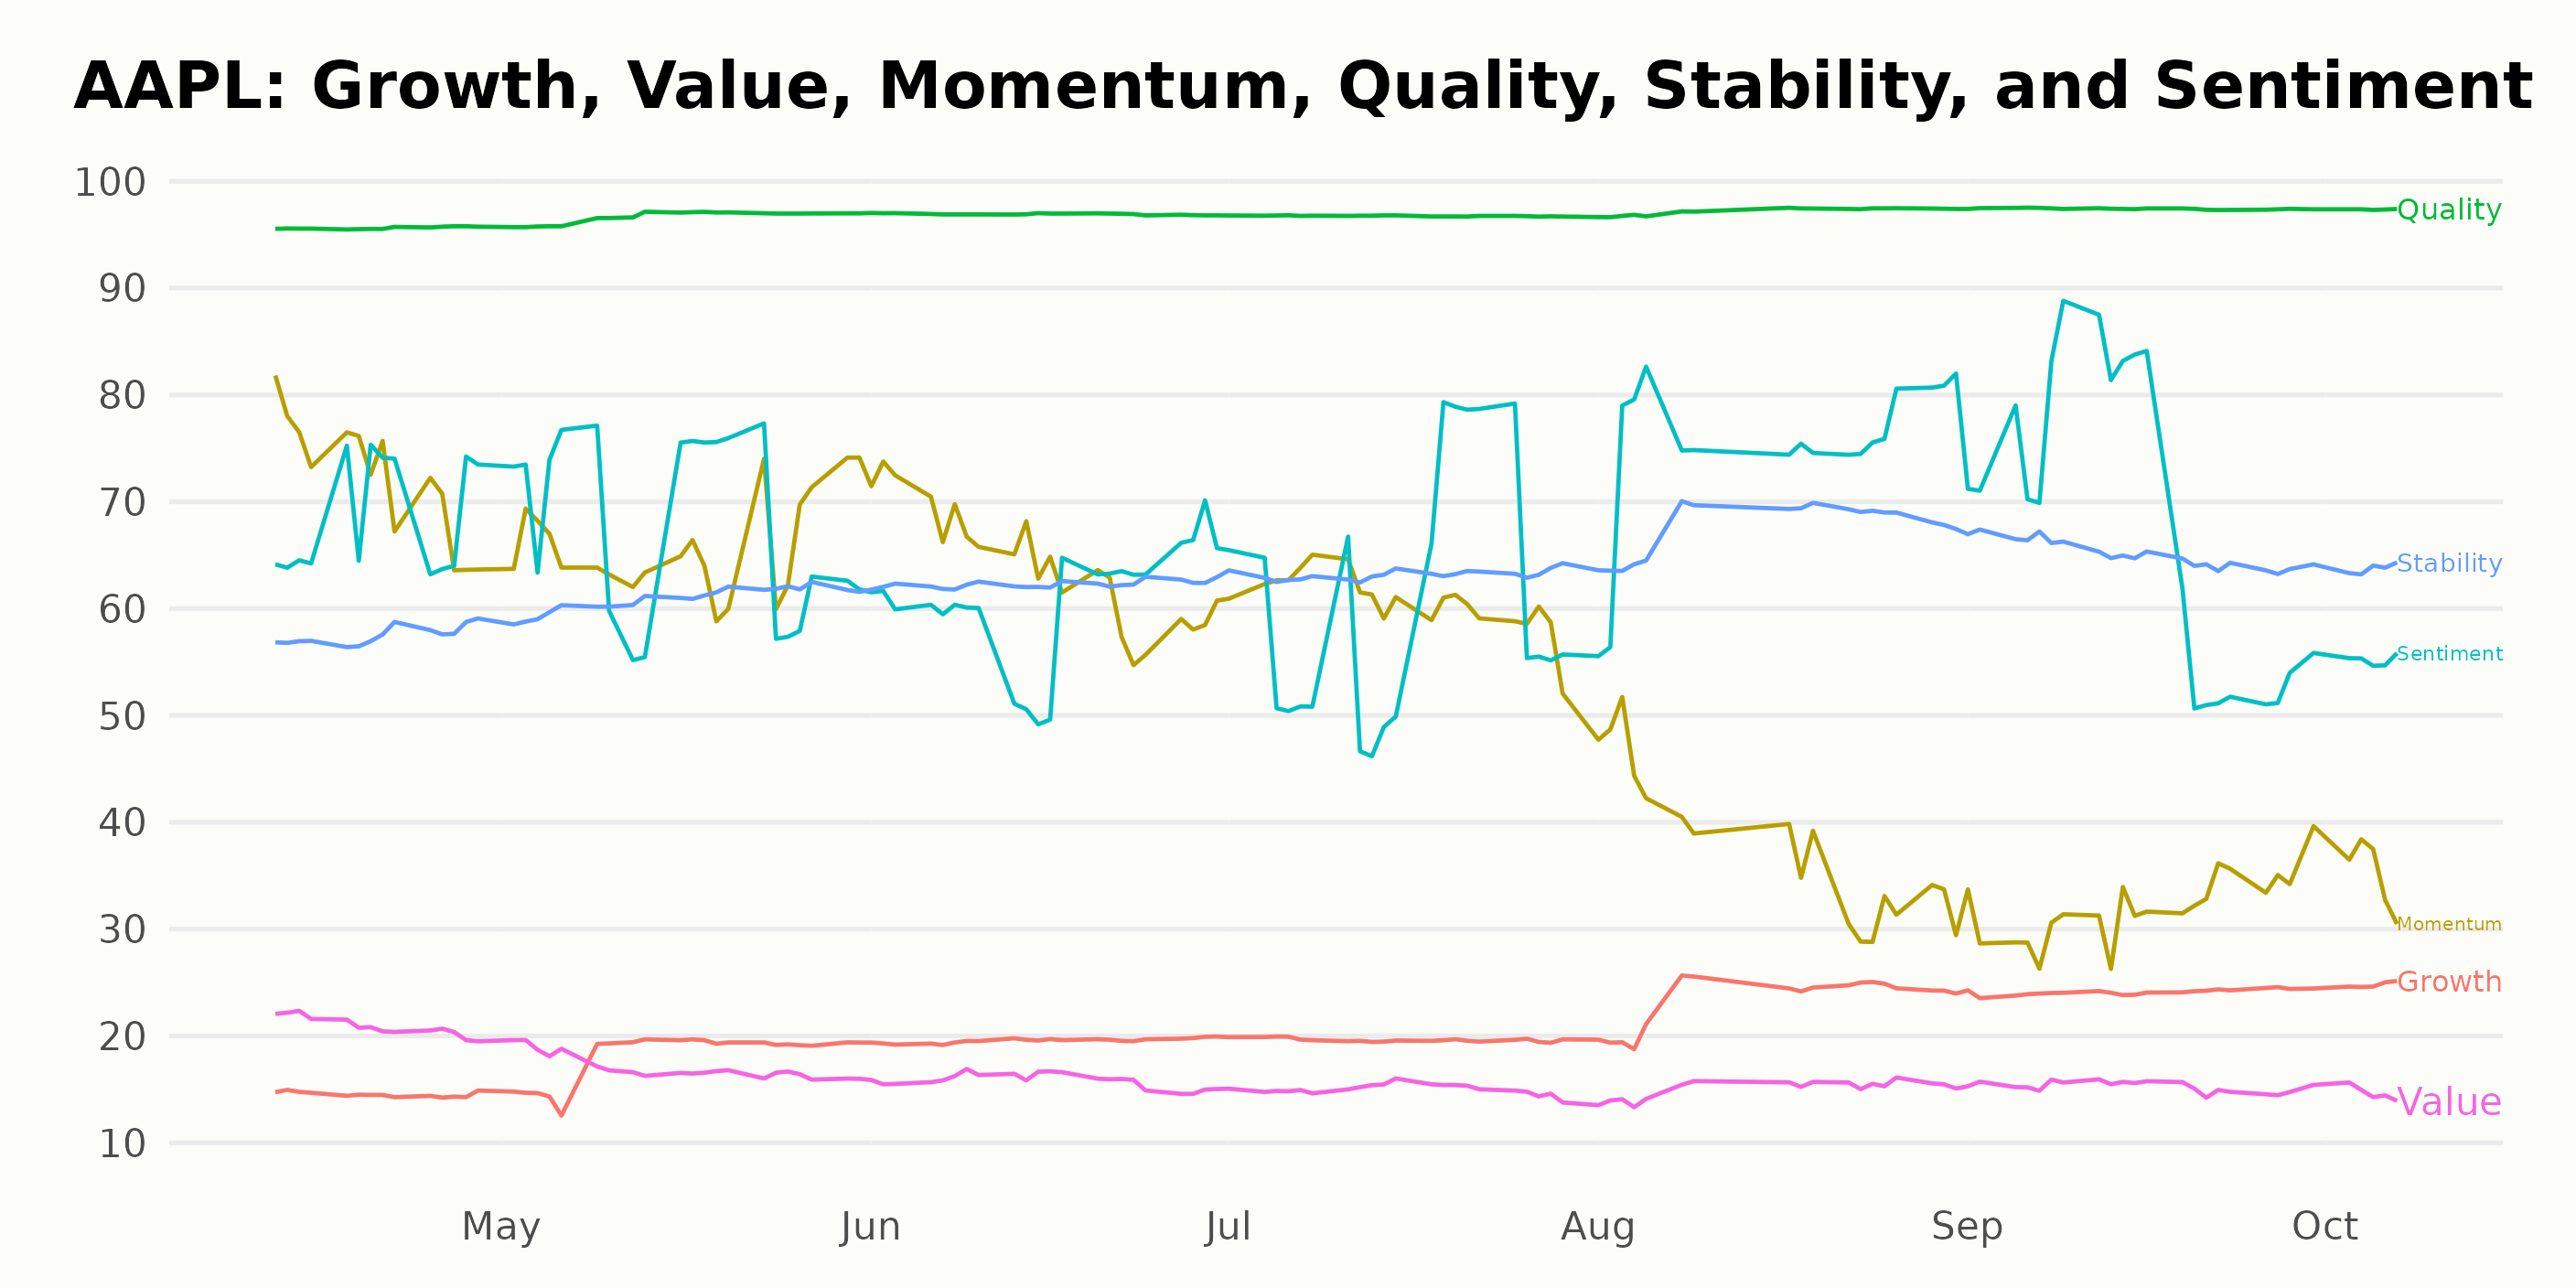
From the provided POWR Ratings data for AAPL, we can observe that the three most noteworthy dimensions are Quality, Momentum, and Sentiment.
Quality: This is the highest-rated dimension among all six for AAPL, with consistent top ratings of 97 from April to October 2023. AAPL's unvarying high-quality score indicates the company's robust financial health and its ability to deliver strong performance consistently.
Momentum: However, a clear declining trend is observed for the Momentum dimension. Starting at a strong rating of 72 in April 2023, it gradually declined month-by-month, eventually reaching a score of 35 by October 2023. This suggests that AAPL's stock price performance has been weakening over this period.
Sentiment: The Sentiment dimension displays some fluctuation through the time period, but it notably jumps from a score of 61 in July to 75 in August 2023, indicating there might have been positive news or favorable market conditions influencing investor sentiment toward AAPL during this time.
The above analysis reveals key strengths of AAPL, such as maintaining high Quality while also highlighting potential concerns like slowing Momentum. Notwithstanding any fluctuations observed, offer insights into how investor sentiment might have varied over the given period.
How does Apple Inc. (AAPL) Stack Up Against its Peers?
Other stocks in the Technology - Hardware sector that may be worth considering are Daktronics, Inc. (DAKT), Panasonic Holdings Corporation (PCRFY), and Iteris, Inc. (ITI) - they have better POWR Ratings. Click here to explore more stocks in the Technology – Hardware industry.
What To Do Next?
43 year investment veteran, Steve Reitmeister, has just released his 2024 market outlook along with trading plan and top 11 picks for the year ahead.
AAPL shares were trading at $178.85 per share on Monday afternoon, up $1.36 (+0.77%). Year-to-date, AAPL has gained 38.24%, versus a 14.31% rise in the benchmark S&P 500 index during the same period.
About the Author: Anushka Dutta

Anushka is an analyst whose interest in understanding the impact of broader economic changes on financial markets motivated her to pursue a career in investment research.
The post Eyes on Apple (AAPL): Is Now a Smart Time to Buy Tech? appeared first on StockNews.com