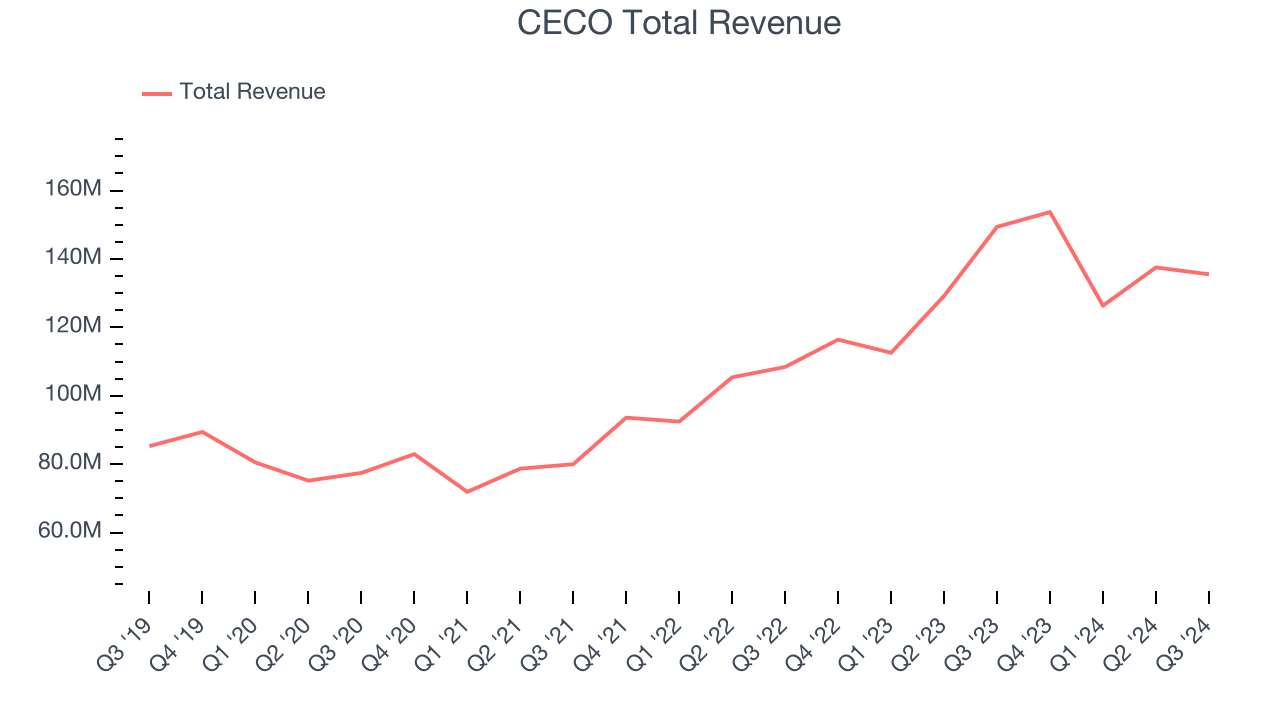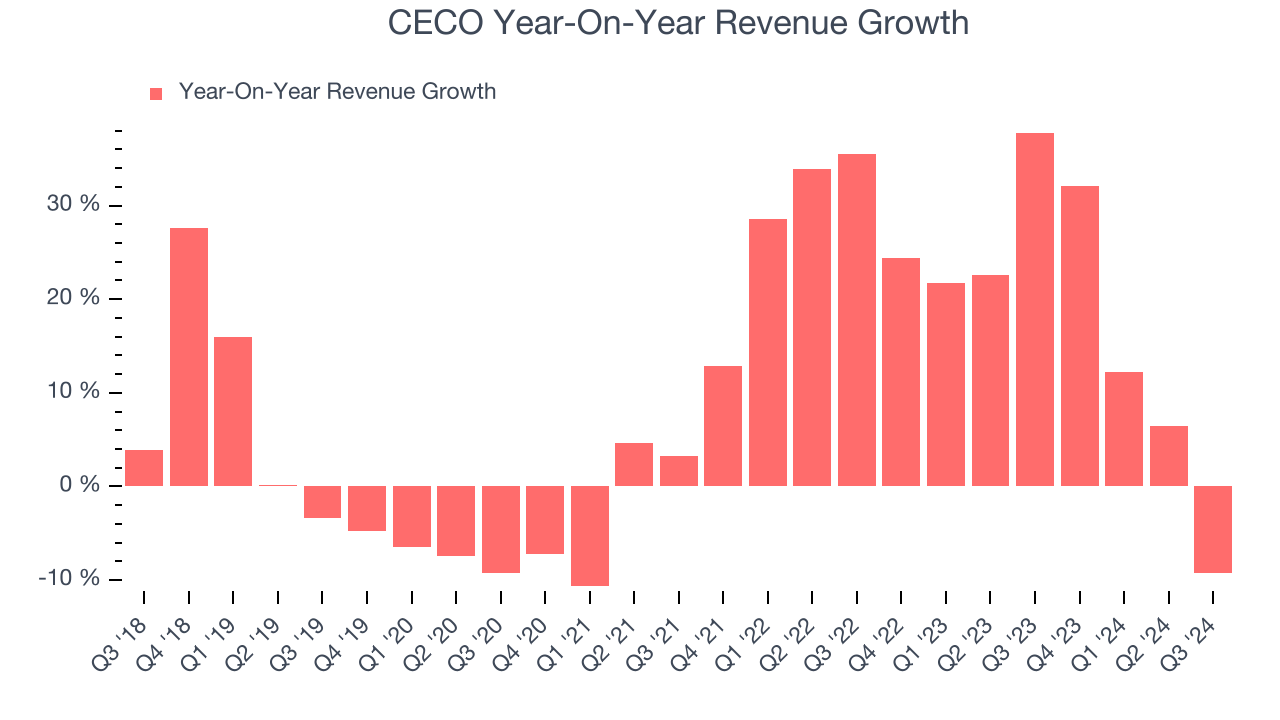
Air quality and fluid handling company CECO (NASDAQ:CECO) fell short of the market’s revenue expectations in Q3 CY2024, with sales falling 9.3% year on year to $135.5 million. The company’s full-year revenue guidance of $587.5 million at the midpoint also came in 3.2% below analysts’ estimates. Its non-GAAP profit of $0.14 per share was also 29.4% below analysts’ consensus estimates.
Is now the time to buy CECO? Find out by accessing our full research report, it’s free.
CECO (CECO) Q3 CY2024 Highlights:
- Revenue: $135.5 million vs analyst estimates of $155.9 million (13.1% miss)
- Adjusted EPS: $0.14 vs analyst expectations of $0.20 (29.4% miss)
- EBITDA: $14.3 million vs analyst estimates of $16.34 million (12.5% miss)
- The company dropped its revenue guidance for the full year to $587.5 million at the midpoint from $610 million, a 3.7% decrease
- EBITDA guidance for the full year is $67.5 million at the midpoint , below analyst estimates of $70.56 million
- Gross Margin (GAAP): 33.4%, up from 28.9% in the same quarter last year
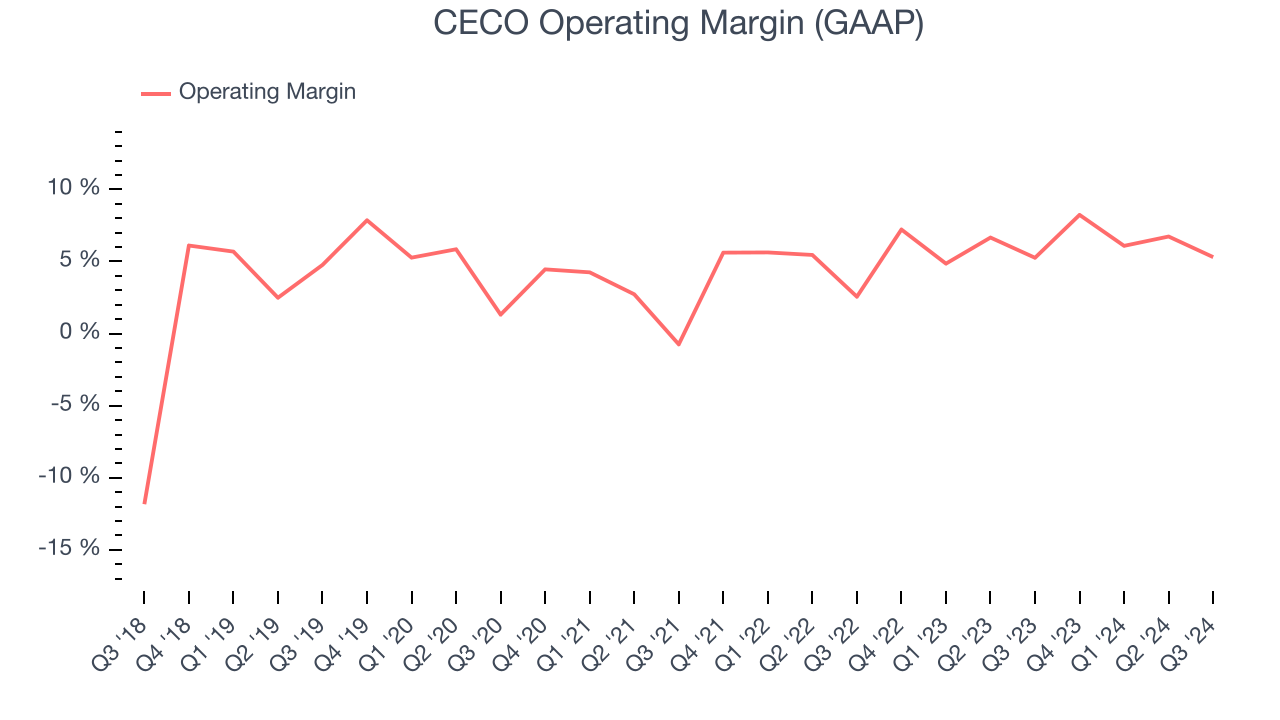
- Operating Margin: 5.3%, in line with the same quarter last year
- EBITDA Margin: 10.6%, in line with the same quarter last year
- Market Capitalization: $919.8 million
Todd Gleason, CECO’s Chief Executive Officer commented, “While our third quarter produced very strong orders and a new record backlog, we were disappointed that we fell short of the anticipated quarterly revenue and income outlook as a handful of customer-driven delays in larger projects could not be overcome by continued progress with margin expansion and other actions. These delayed projects are expected to begin activity over the coming months and the impact is reflected in our updated full year 2024 and newly introduced full year 2025 outlook. We are excited to have been awarded several large energy transition and general industrial orders in the quarter and we anticipate this trend to continue as we are forecasting a very strong fourth quarter bookings period.”
Company Overview
Started in a Cincinnati garage, CECO (NASDAQ:CECO) is a global provider of industrial air quality and fluid handling systems.
Gas and Liquid Handling
Gas and liquid handling companies possess the technical know-how and specialized equipment to handle valuable (and sometimes dangerous) substances. Lately, water conservation and carbon capture–which requires hydrogen and other gasses as well as specialized infrastructure–have been trending up, creating new demand for products such as filters, pumps, and valves. On the other hand, gas and liquid handling companies are at the whim of economic cycles. Consumer spending and interest rates, for example, can greatly impact the industrial production that drives demand for these companies’ offerings.
Sales Growth
A company’s long-term performance can give signals about its business quality. Even a bad business can shine for one or two quarters, but a top-tier one grows for years. Luckily, CECO’s sales grew at a solid 9.8% compounded annual growth rate over the last five years. This is a good starting point for our analysis.

Long-term growth is the most important, but within industrials, a half-decade historical view may miss new industry trends or demand cycles. CECO’s annualized revenue growth of 17.6% over the last two years is above its five-year trend, suggesting its demand was strong and recently accelerated. 
This quarter, CECO missed Wall Street’s estimates and reported a rather uninspiring 9.3% year-on-year revenue decline, generating $135.5 million of revenue.
Looking ahead, sell-side analysts expect revenue to grow 18.3% over the next 12 months, similar to its two-year rate. This projection is healthy and illustrates the market sees some success for its newer products and services.
Unless you’ve been living under a rock, it should be obvious by now that generative AI is going to have a huge impact on how large corporations do business. While Nvidia and AMD are trading close to all-time highs, we prefer a lesser-known (but still profitable) semiconductor stock benefitting from the rise of AI. Click here to access our free report on our favorite semiconductor growth story.
Operating Margin
Operating margin is one of the best measures of profitability because it tells us how much money a company takes home after procuring and manufacturing its products, marketing and selling them, and, most importantly, keeping them relevant through research and development.
CECO was profitable over the last five years but held back by its large cost base. Its average operating margin of 5.3% was weak for an industrials business.
On the bright side, CECO’s annual operating margin rose by 1.5 percentage points over the last five years, as its sales growth gave it operating leverage.

This quarter, CECO generated an operating profit margin of 5.3%, in line with the same quarter last year. This indicates the company’s cost structure has recently been stable.
Earnings Per Share
We track the long-term change in earnings per share (EPS) for the same reason as long-term revenue growth. Compared to revenue, however, EPS highlights whether a company’s growth was profitable.
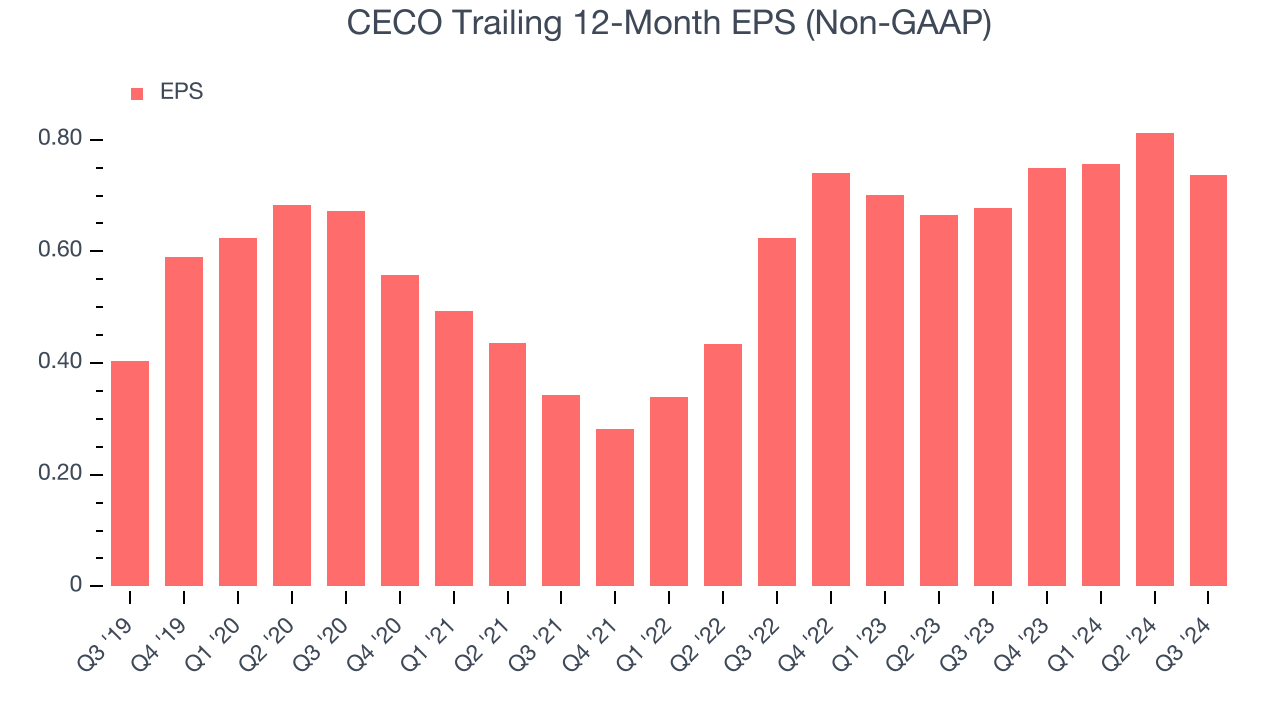
CECO’s EPS grew at a remarkable 12.8% compounded annual growth rate over the last five years, higher than its 9.8% annualized revenue growth. This tells us the company became more profitable as it expanded.

Diving into the nuances of CECO’s earnings can give us a better understanding of its performance. As we mentioned earlier, CECO’s operating margin was flat this quarter but expanded by 1.5 percentage points over the last five years. This was the most relevant factor (aside from the revenue impact) behind its higher earnings; taxes and interest expenses can also affect EPS but don’t tell us as much about a company’s fundamentals.
Like with revenue, we analyze EPS over a more recent period because it can give insight into an emerging theme or development for the business.
For CECO, its two-year annual EPS growth of 8.7% was lower than its five-year trend. This wasn’t great, but at least the company was successful in other measures of financial health.In Q3, CECO reported EPS at $0.14, down from $0.22 in the same quarter last year. This print missed analysts’ estimates, but we care more about long-term EPS growth than short-term movements. Over the next 12 months, Wall Street expects CECO’s full-year EPS of $0.74 to grow by 49.8%.
Key Takeaways from CECO’s Q3 Results
We struggled to find many positives in these results. Its revenue, EBITDA, and EPS missed while its full-year revenue and EBITDA guidance fell short of Wall Street’s estimates. Overall, this quarter could have been better. The stock traded down 10.6% to $23.50 immediately following the results.
CECO may have had a tough quarter, but does that actually create an opportunity to invest right now?When making that decision, it’s important to consider its valuation, business qualities, as well as what has happened in the latest quarter. We cover that in our actionable full research report which you can read here, it’s free.


